ODC boosts CMAA’s analytical skills in Battambang
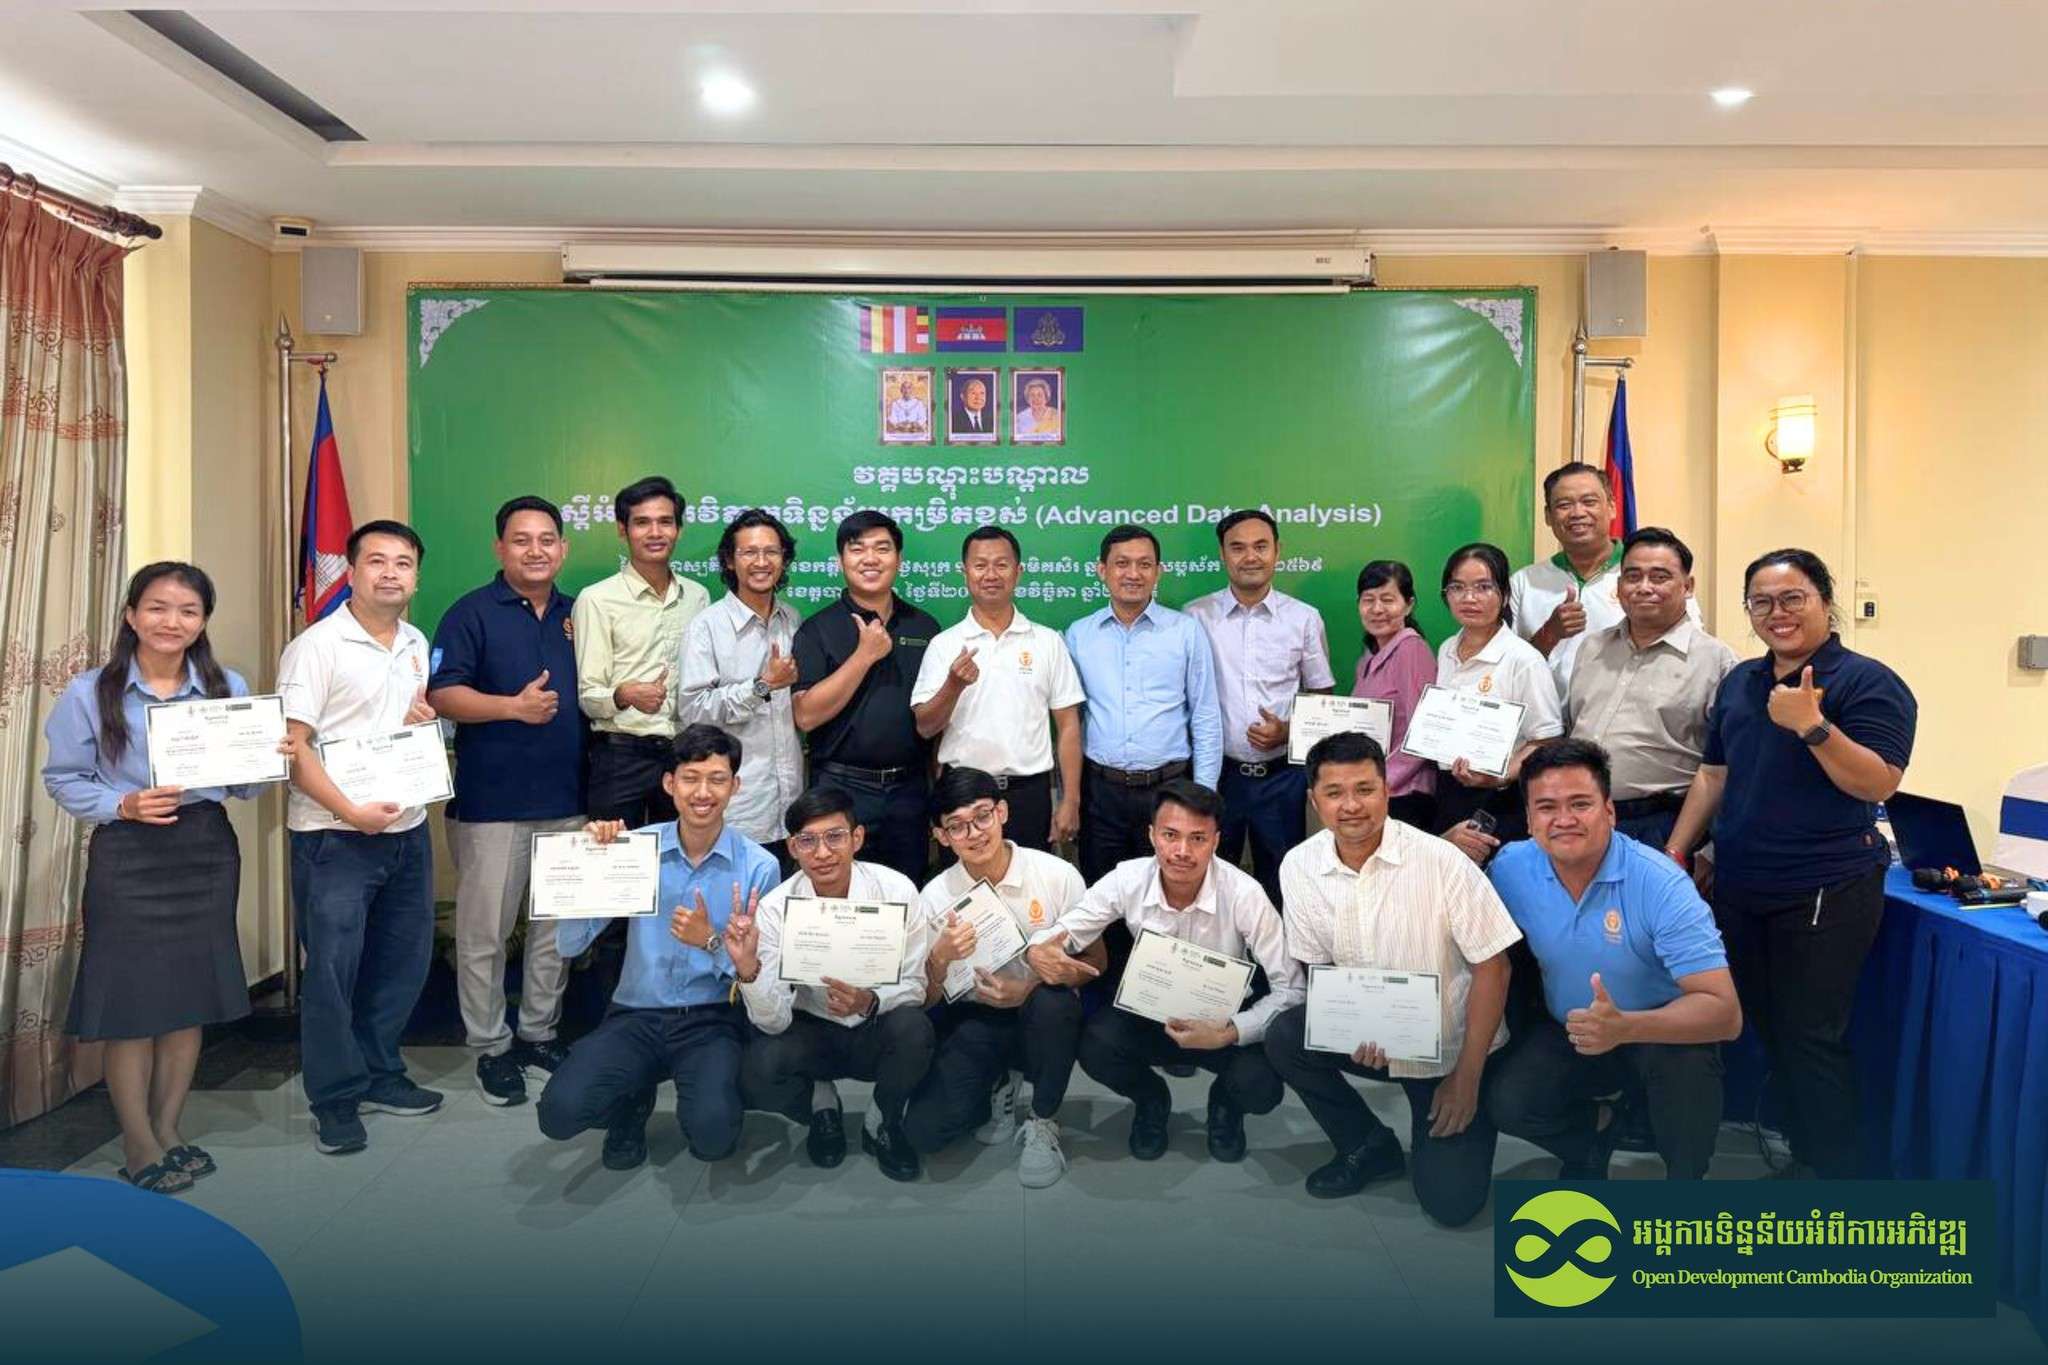
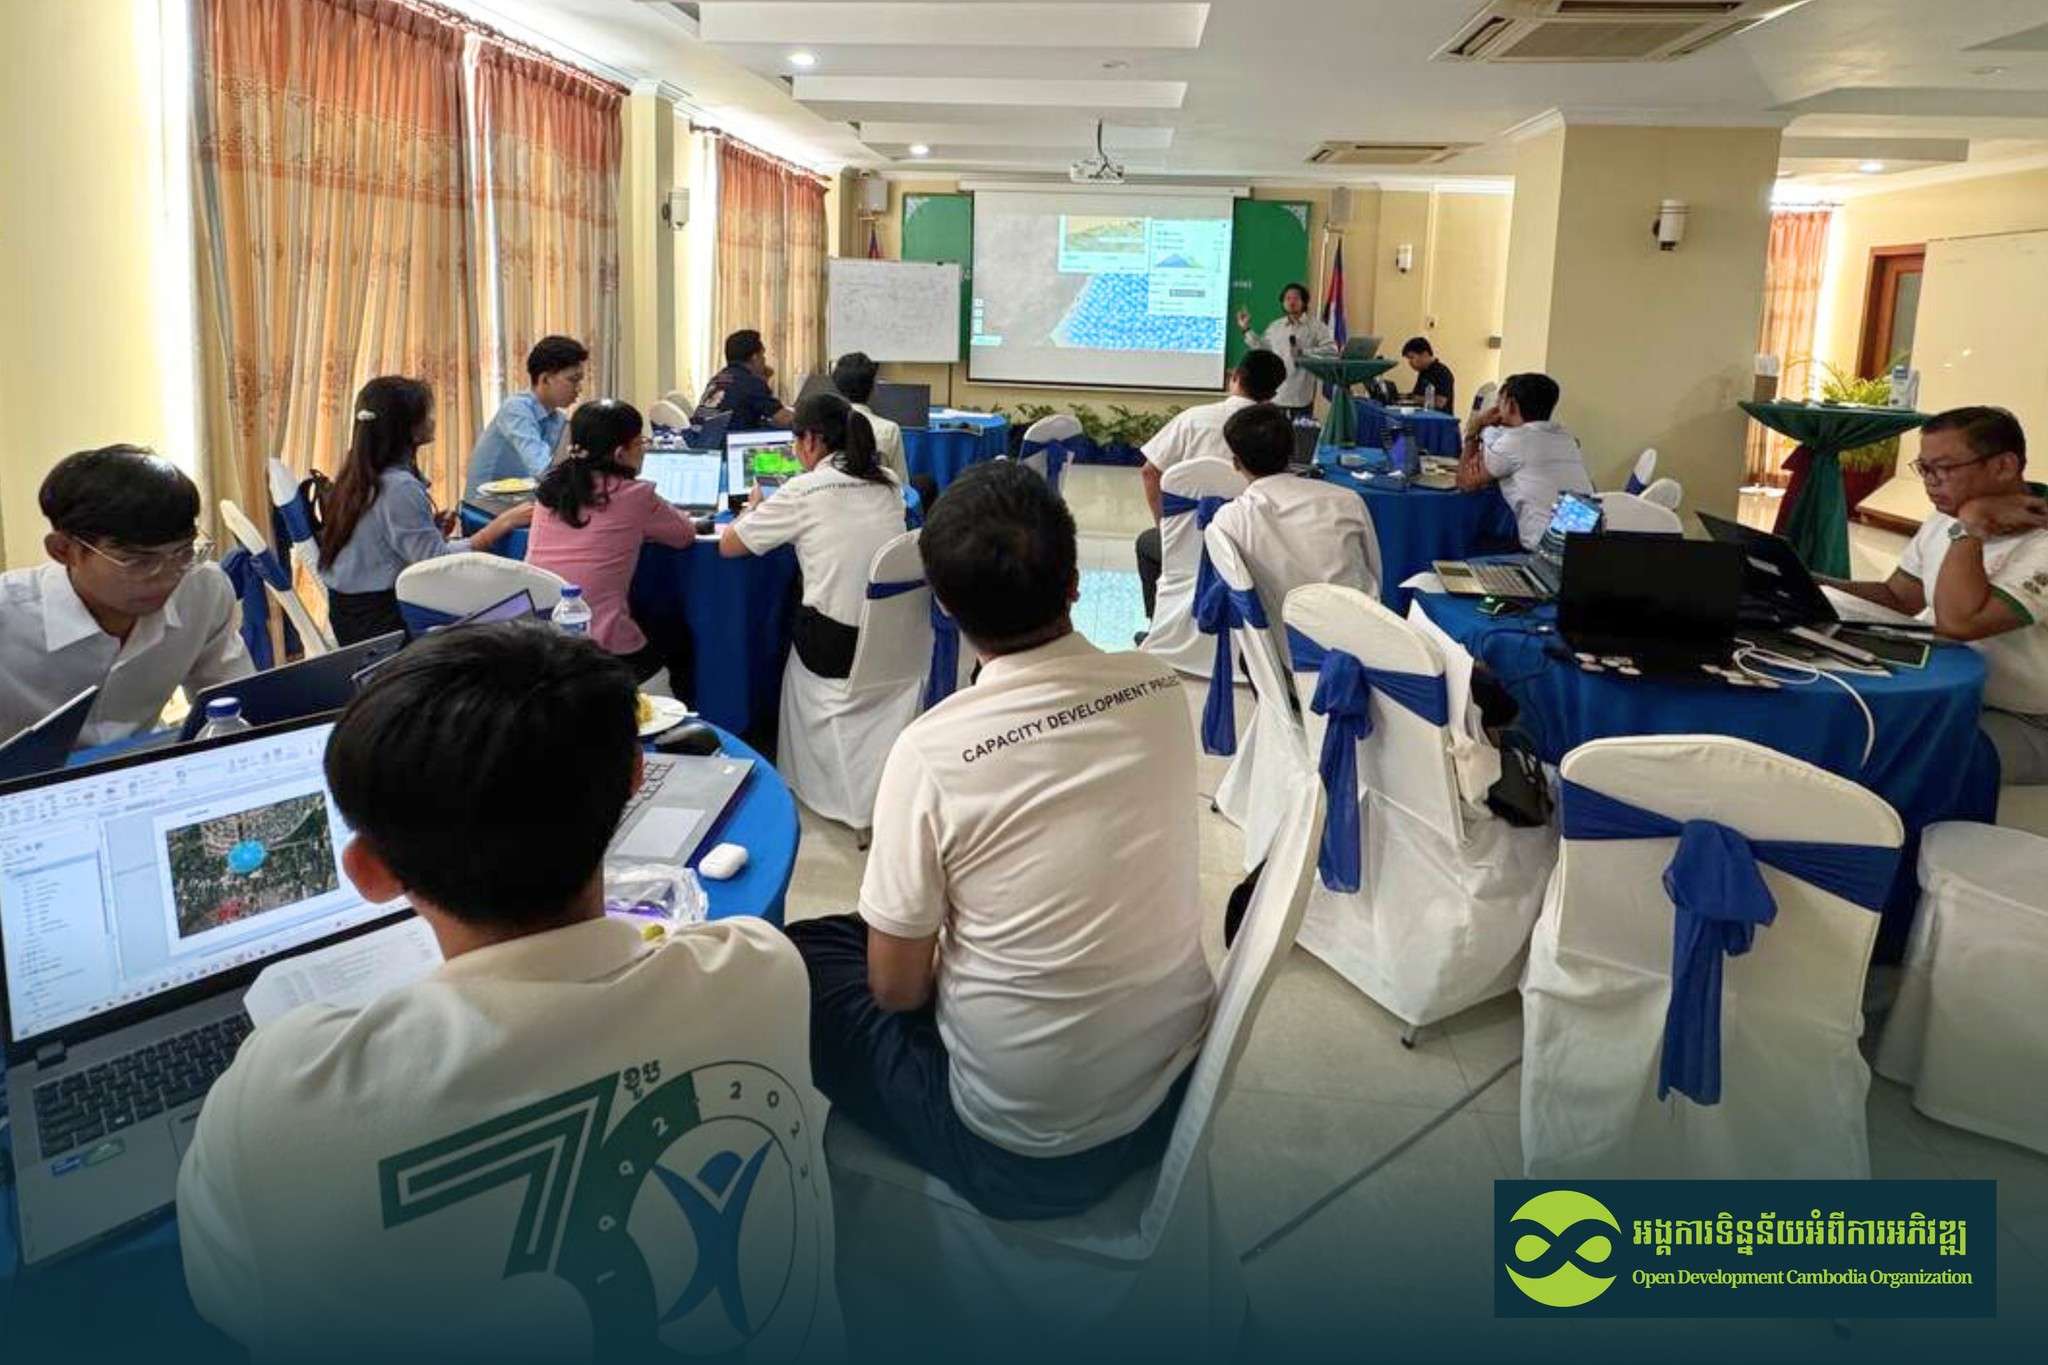
On 20–21 November 2025, Open Development Cambodia (ODC) conducted a two-day Advanced Data Analysis training program for the Database Unit (DBU) of the Cambodian Mine Action Authority (CMAA). The training held at Classy Hotel in Battambang was supported by the Norwegian People’s Aid (NPA) and aimed to strengthen both conceptual understanding and practical skills in modern analytical tools relevant to the mine action sector.
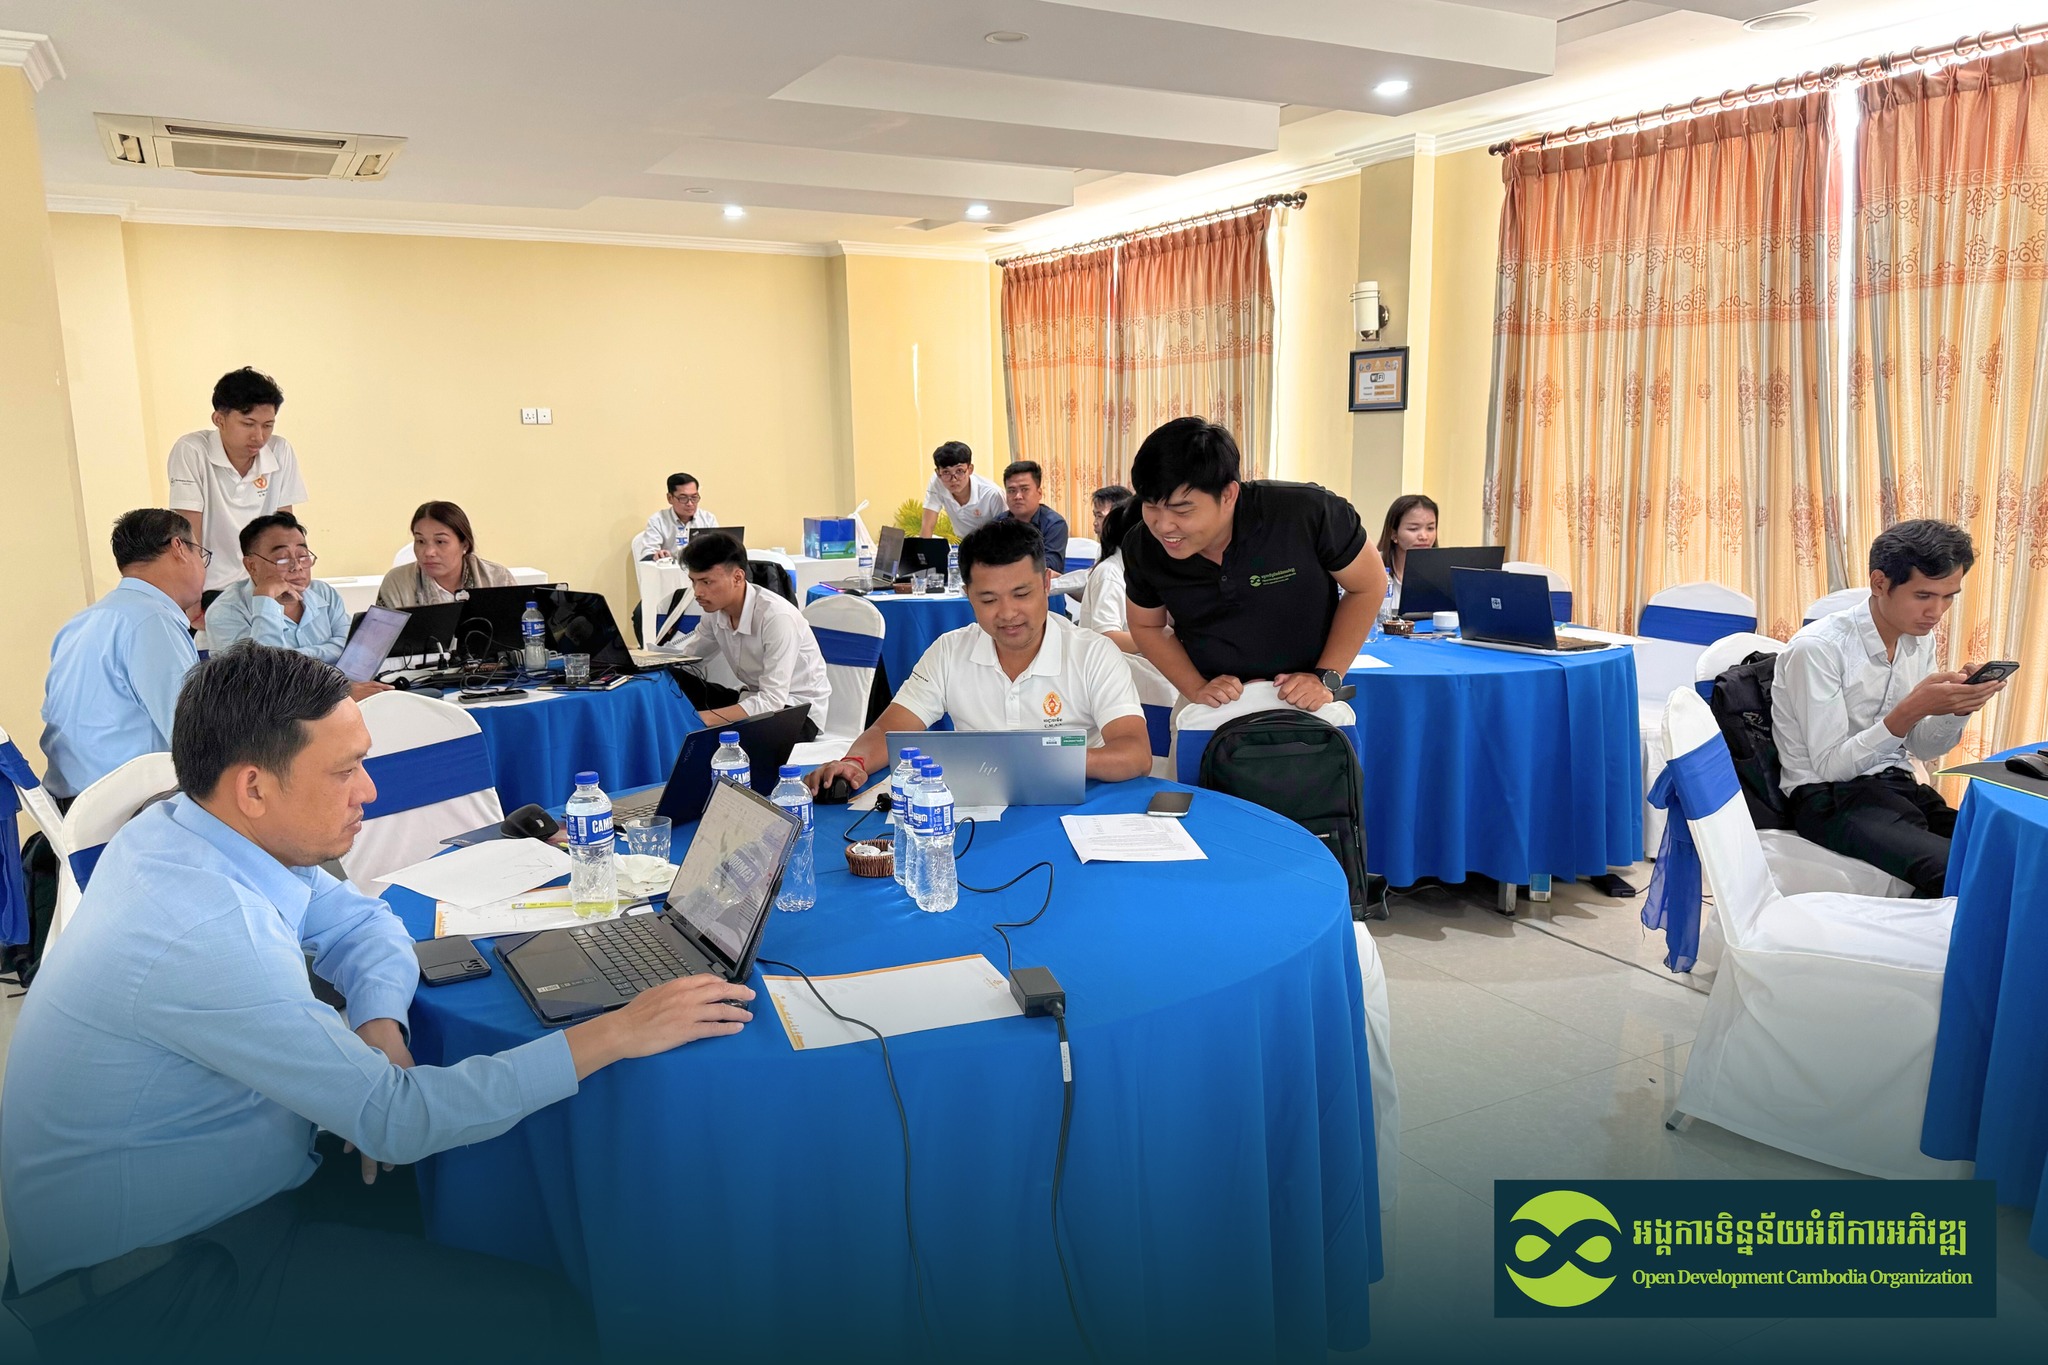
The program brought together 16 participants (including 3 females) from CMAA and NPA, offering a comprehensive mix of lectures, group discussions, and hands-on exercises in Excel, Power Query, GIS, and basic Python techniques.
Training Day 1: Understanding and Preparing Data
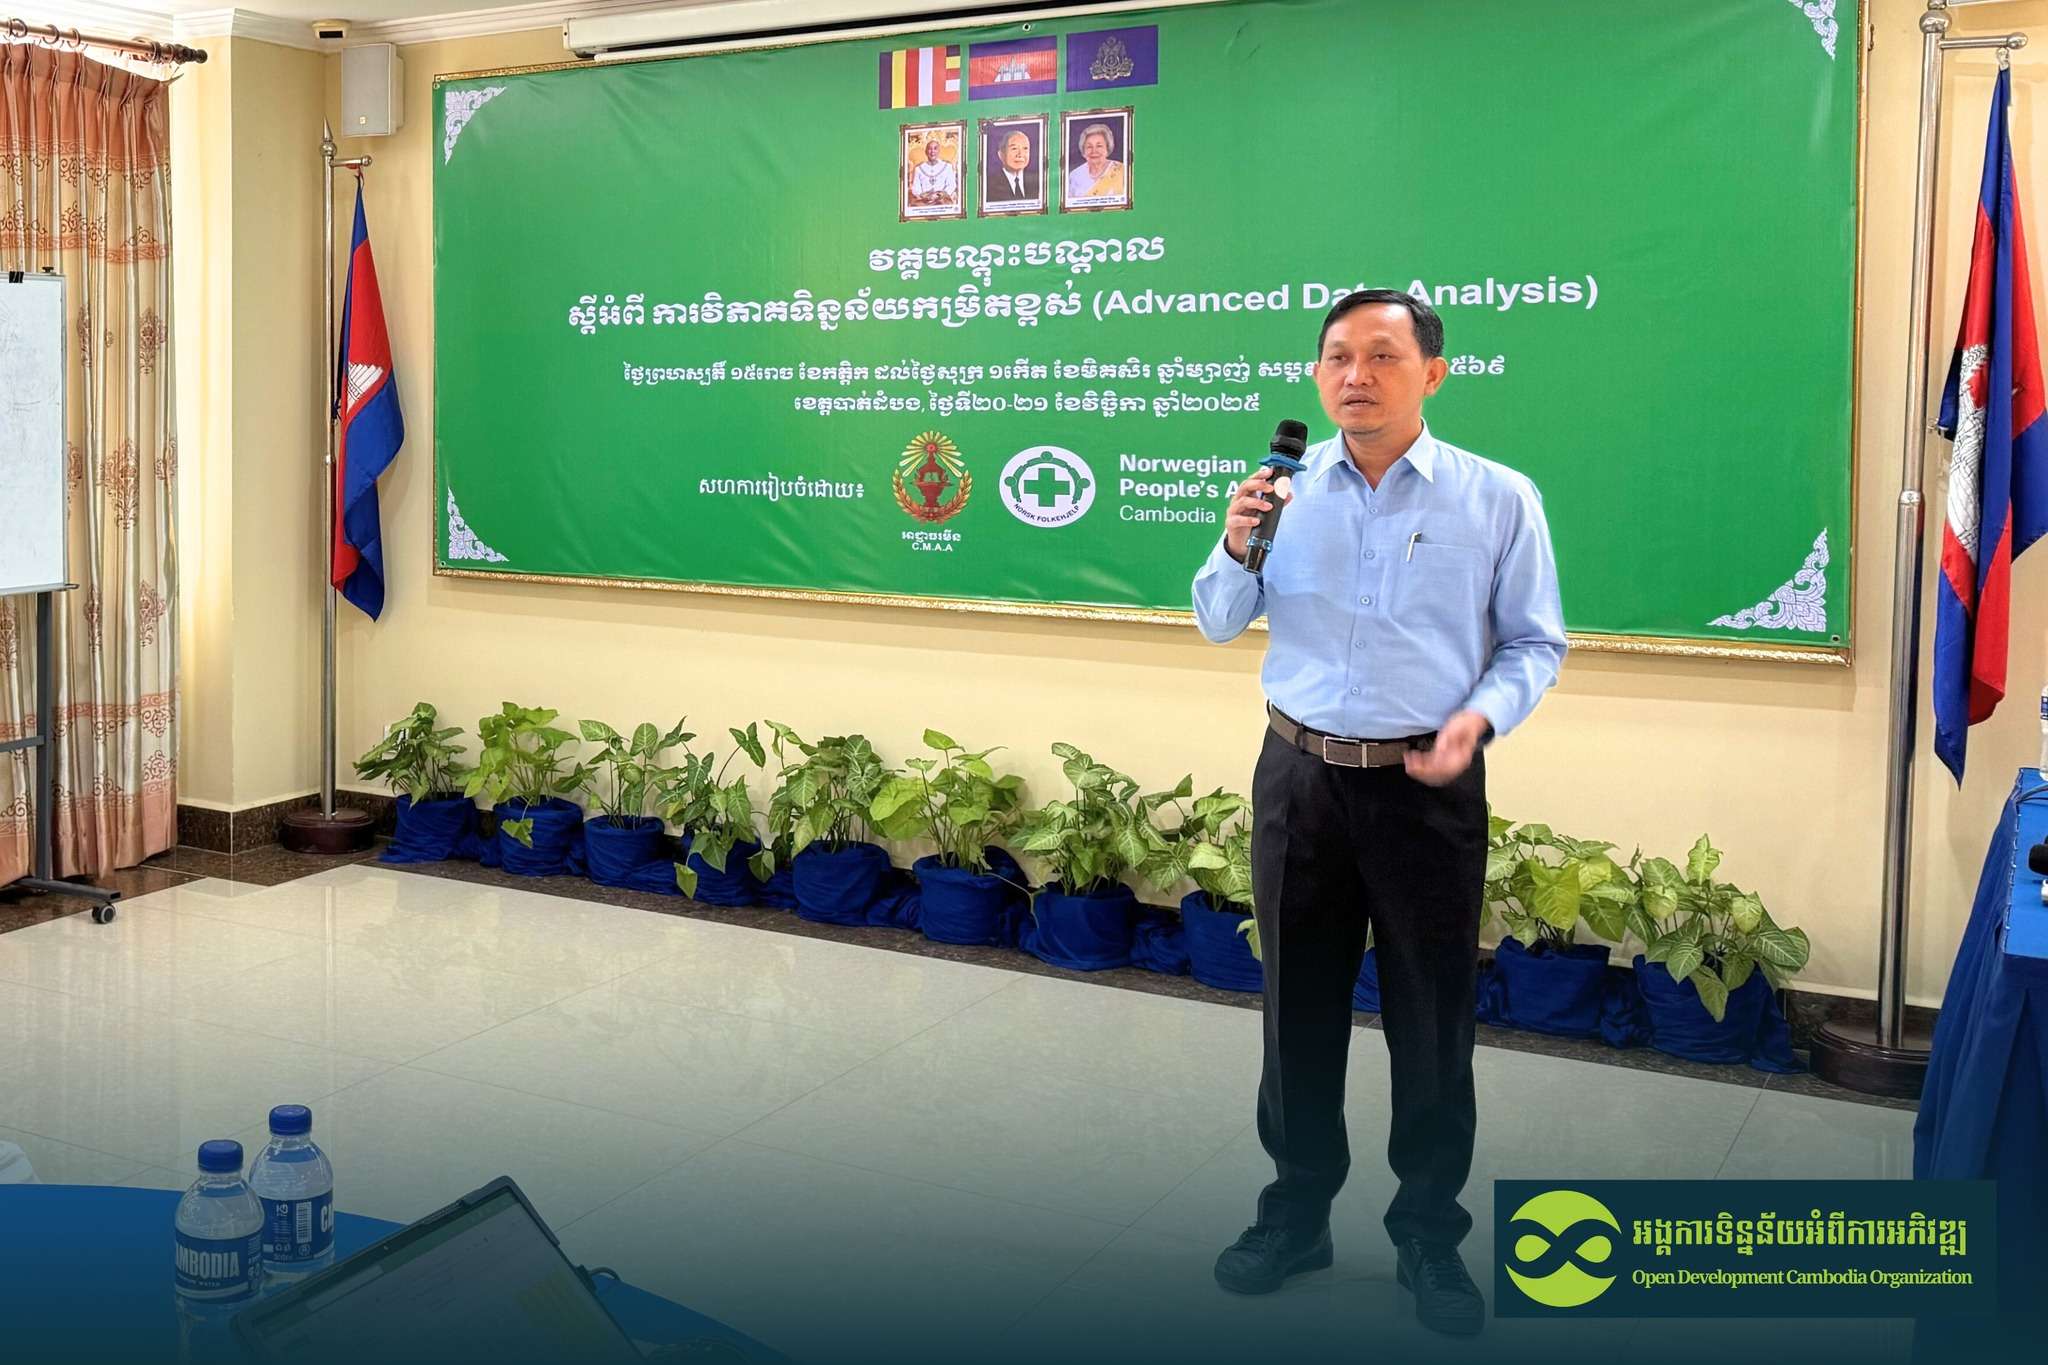
The session opened with welcoming remarks from Mr. Chea Chetra (NPA), who highlighted the importance of strengthening skills in data visualization and analytical thinking. He noted that while some participants already work with technical tools and GIS, others are newer to the field, making the training intentionally inclusive of all skill levels.
Mr. Sam An Mardy then introduced the training protocols, followed by participant introductions and the creation of a dedicated Telegram group for communication throughout the sessions. After a group photo and a short pre-test, the training officially began.
Data Foundations and Cleaning Techniques
The trainer introduced the fundamentals of data understanding and preparation, emphasizing the importance of Metadata and data dictionaries and cleaning raw data before analysis. Participants practiced cleaning datasets using Excel functions and Power Query, including trimming extra spaces, removing duplicates, and generating PivotTables.
Introduction to Geospatial Data
Participants were then introduced to the basics of geospatial data, including:
- The difference between vector and raster formats
- How spatial data represents real-world features.
This foundational knowledge prepared them for deeper GIS activities.
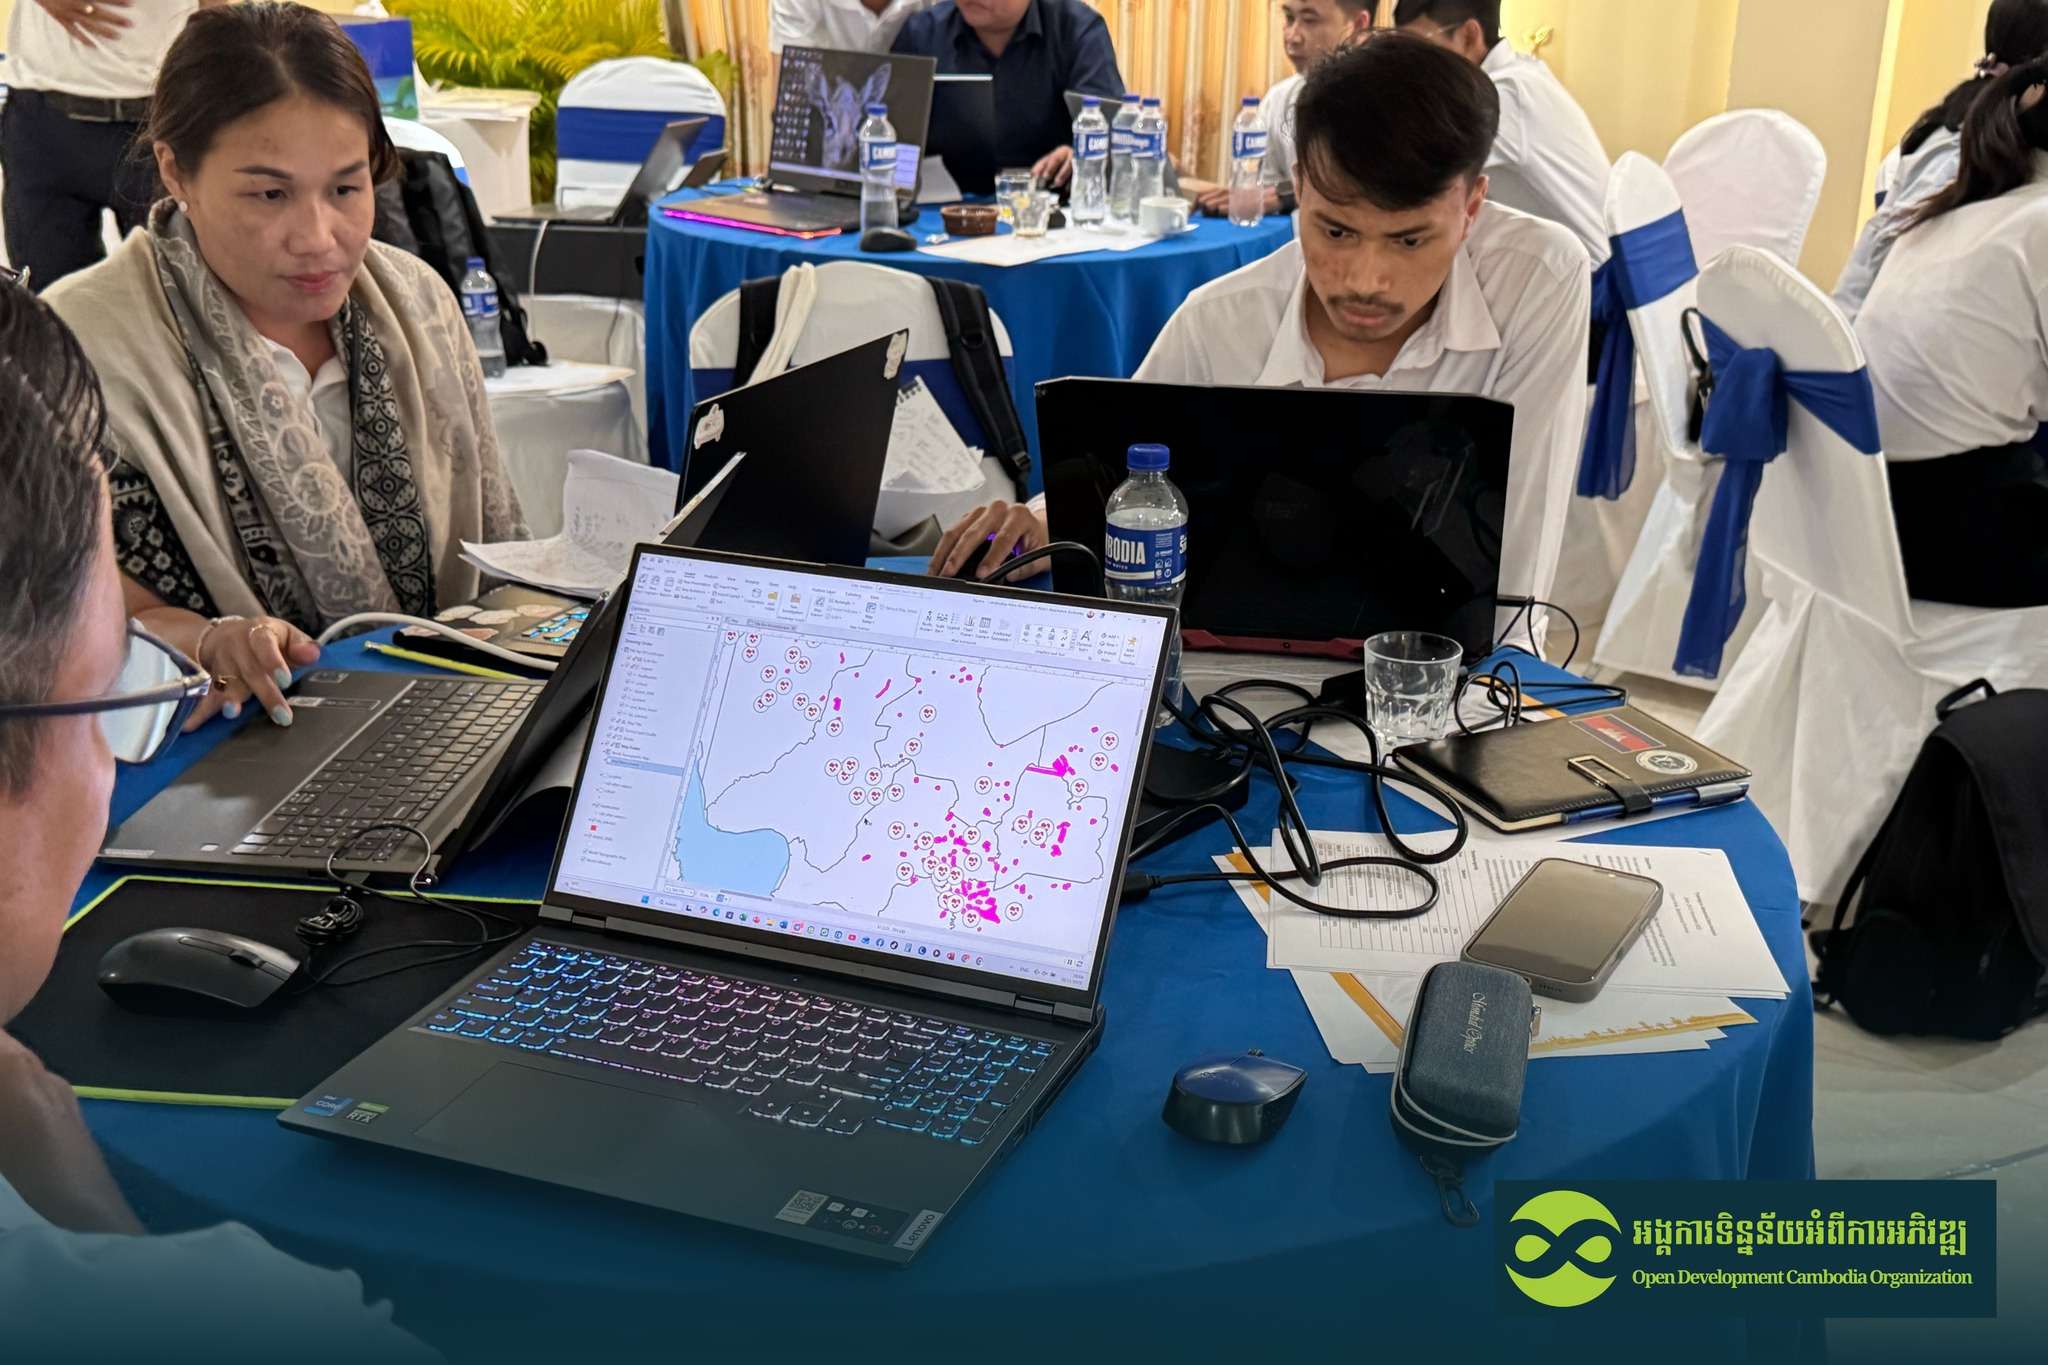
Descriptive Analysis and GIS Visualizations
Using geospatial mine-related datasets, participants explored descriptive statistics and spatial patterns. They practiced working with symbology, creating heat maps, and identifying high-risk or accident-prone sites. Participants presented their maps and visualizations, offering insights and learning from one another’s analytical approaches. The day concluded with guidance on producing effective maps and designing meaningful data visualizations.
Training Day 2: Digging Deeper into Analysis
The second day began with reflections on key takeaways from Day 1. Participants highlighted several major learnings:
Key Learnings from Day 1
- Data Preparation: Importance of clean, structured, and well-documented data
- GIS Concepts: Better understanding of raster vs. vector data and their uses
- Heat Map Analysis: Identifying accident hotspots.
- Tools:
- Power Query to speed up cleaning and integration.
- Basic Python for data manipulation
- Map Elements: Understanding essential components such as scale bars, north arrows, and coordinate systems.
Exploratory data analysis
The trainer demonstrated how to break down temporal data using heat maps and guided participants in formulating descriptive questions. This fostered analytical thinking and improved interpretation of geospatial datasets.
Geospatial Diagnostic Analysis
Participants then moved into diagnostic techniques, working with questions related to real scenarios, such as:
- Distances from accidents to known landmines or UXO
- Proximity to schools and health centers (50m, 100m, 200m)
- Land-use changes at accident locations
- Accident timelines and frequency
- Presence of EORE activities in affected areas
Using these prompts, participants conducted analyses and later presented their findings.
Data Storytelling and Dashboard Design
In the following session, the trainer introduced data storytelling and its three key components:
- Message
- Audience
- Medium
Participants learned how to select the most suitable medium, such as dashboards or reports, to convey clear and impactful data stories.
Visual Communication Principles
The session included guidance on choosing appropriate chart types, avoiding 3D charts and unnecessary colors, and recognizing the emotional impact of color palettes. Participants also explored the principles of dashboard design, which require:
- Clear purpose
- Relevant metrics
- Proper choice of tools and data
- Design and deploy.
Examples of poorly designed dashboards were shown to highlight common pitfalls.
Introduction to Remote Sensing
In the final technical session, participants were introduced to remote sensing and orthophotos, learning how aerial imagery is captured and processed. This knowledge enables a more accurate interpretation of spatial data for applications in forestry, land-use planning, and environmental monitoring.
End of the training workshop
The training concluded with remarks from Mr. Chea Chetra and H.E. Hean Kimsin, Director of CMAA. Both expressed deep appreciation for the participants’ enthusiasm and for the trainers’ contributions. H.E. Hean Kimsin encouraged participants to continue learning beyond the workshop, emphasizing self-development and consistent capacity building.