Workshop 2: Data-driven journalism
You have found an interesting topic to write about? Support your article with data! To learn more about data-driven journalism Open Development Cambodia, in cooperation with Cambodian Center for Independent Media, hosted the second two-day workshop for journalists and journalism students on May 24-25 2018. Dealing with data is tough, but together with some invited experts, the participants are now well prepared to start their own data driven projects.
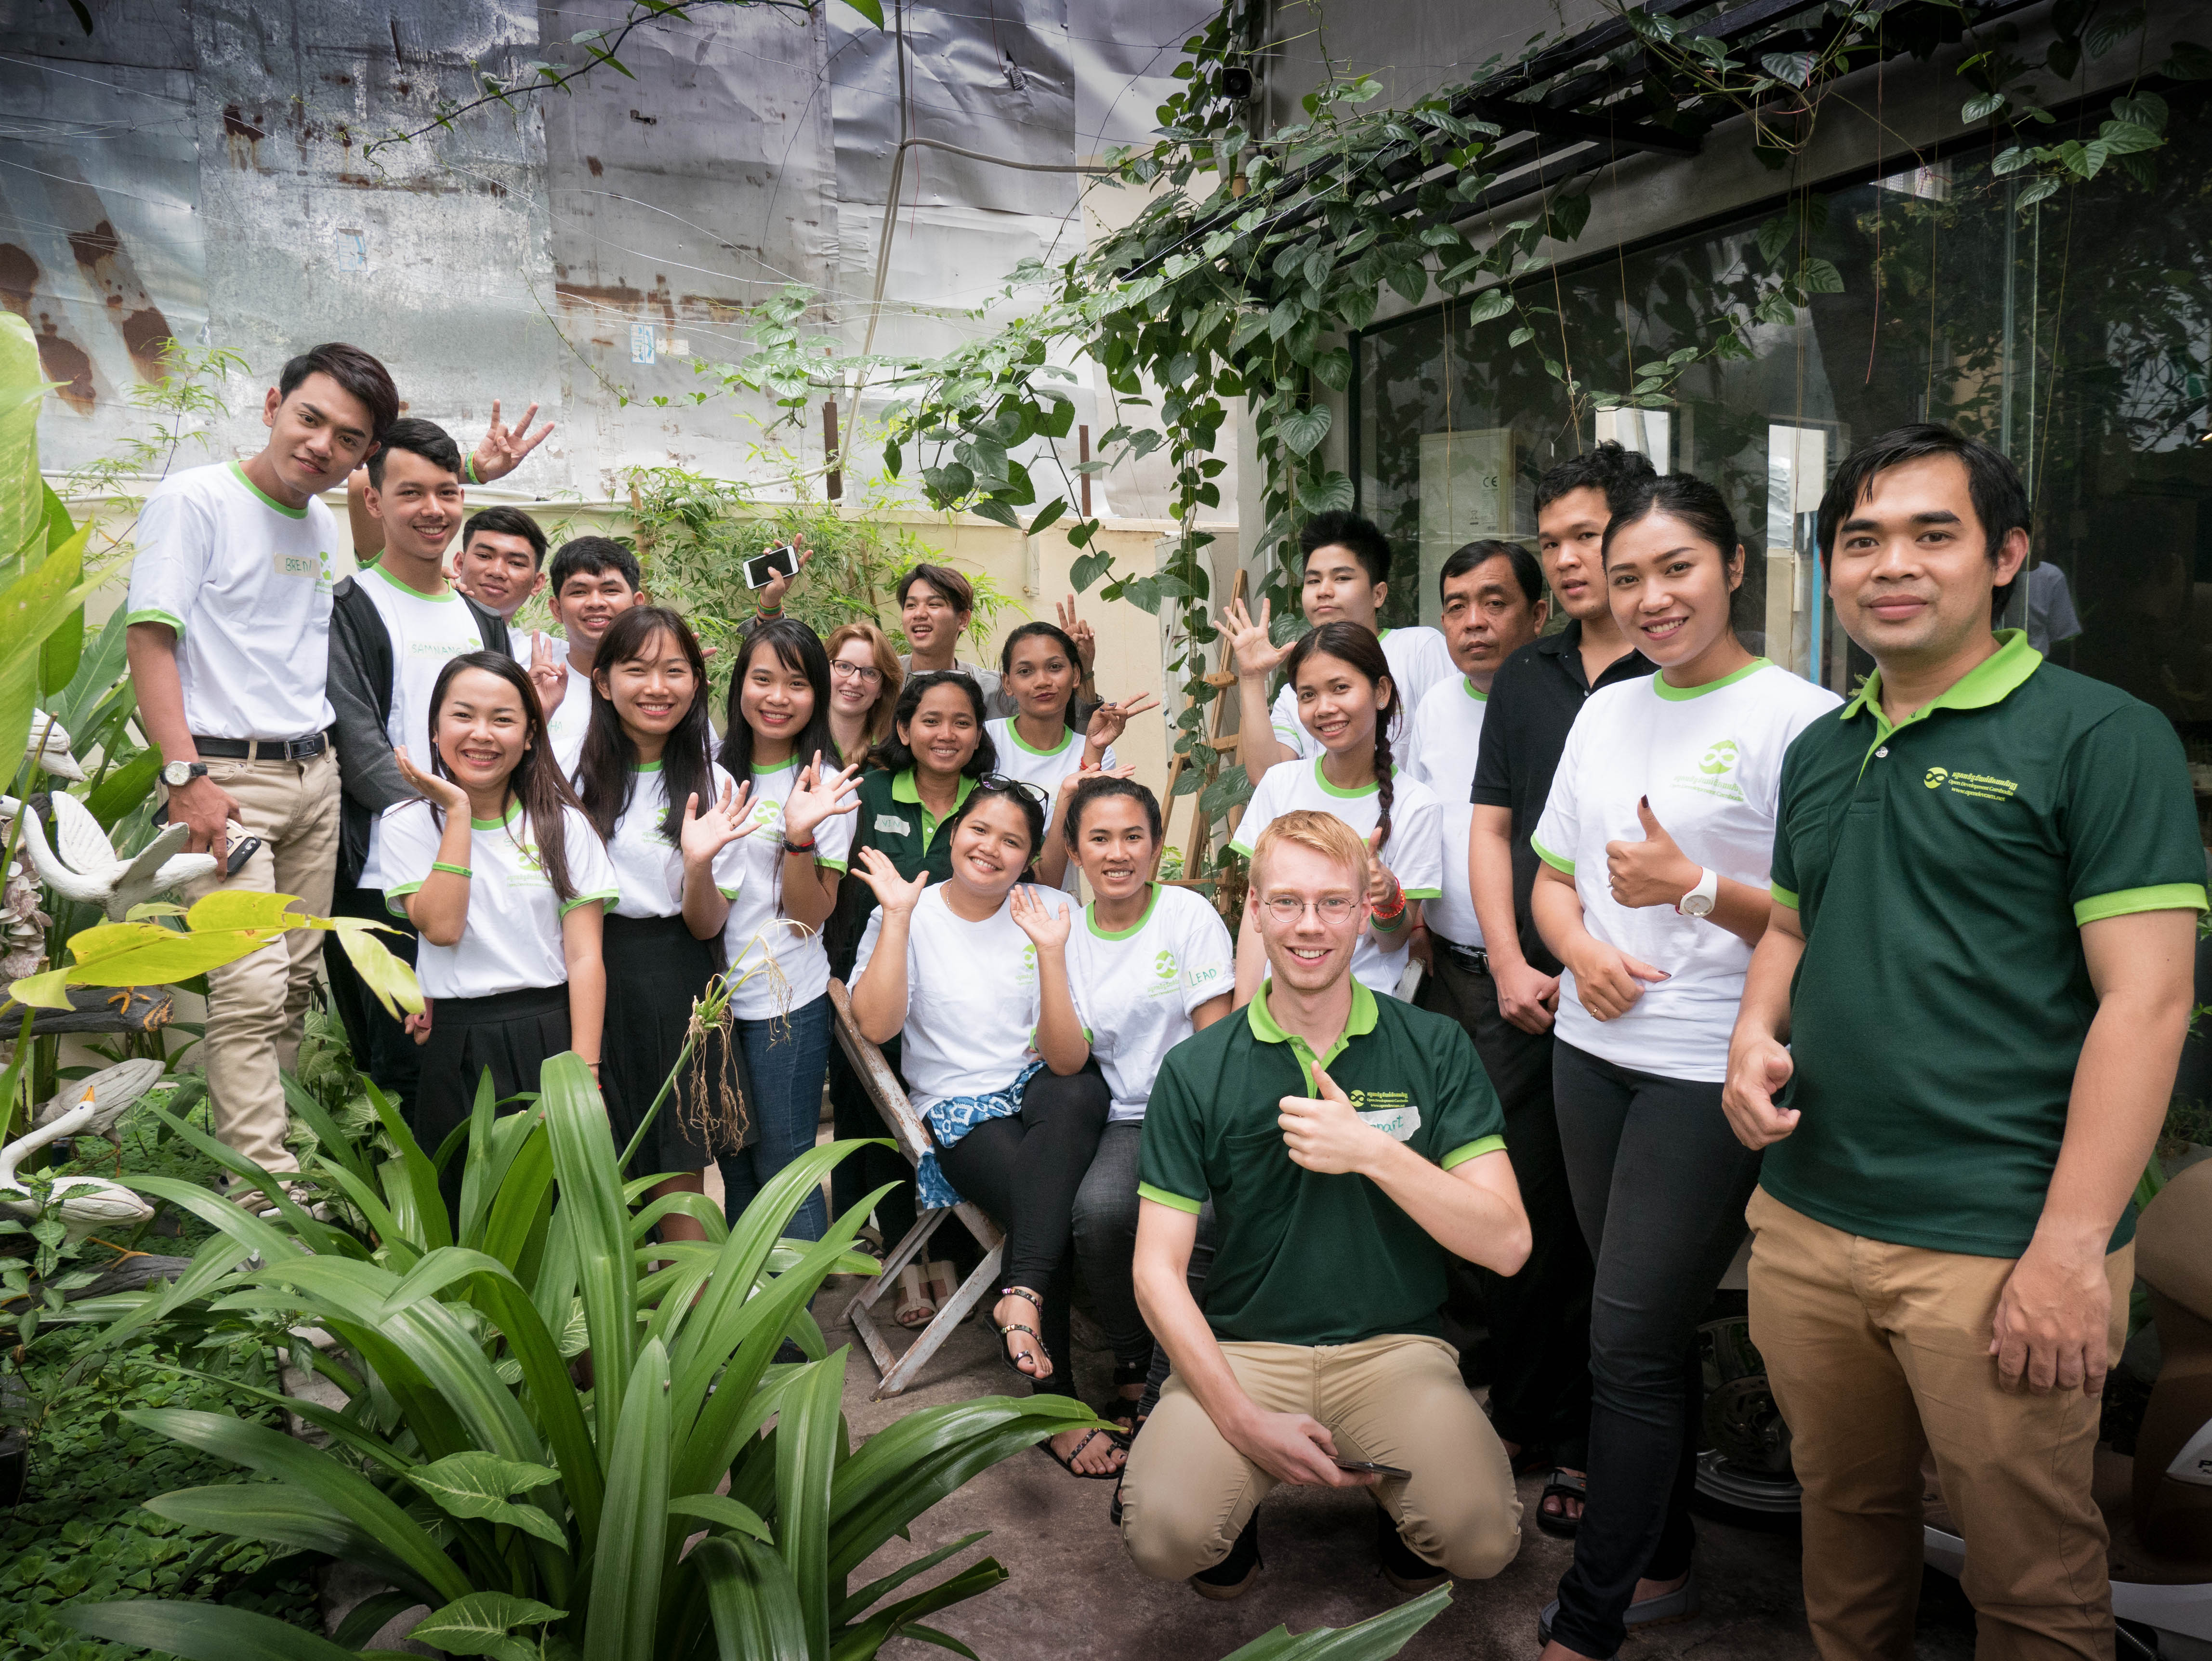
Group photo with participants
What is data?
Data deals with numbers. Sure, but there is so much more about it. Do you know, what a “Tag Cloud” is? Or what “Scraping” means? Same as previous training, but, step by step: first you must find the data, then you have to filter and analyze it. After that you can start your visualization, and, in the end, you can write your stories. The participants had the chance to read best practice examples, to see how a final data-driven article might look like.
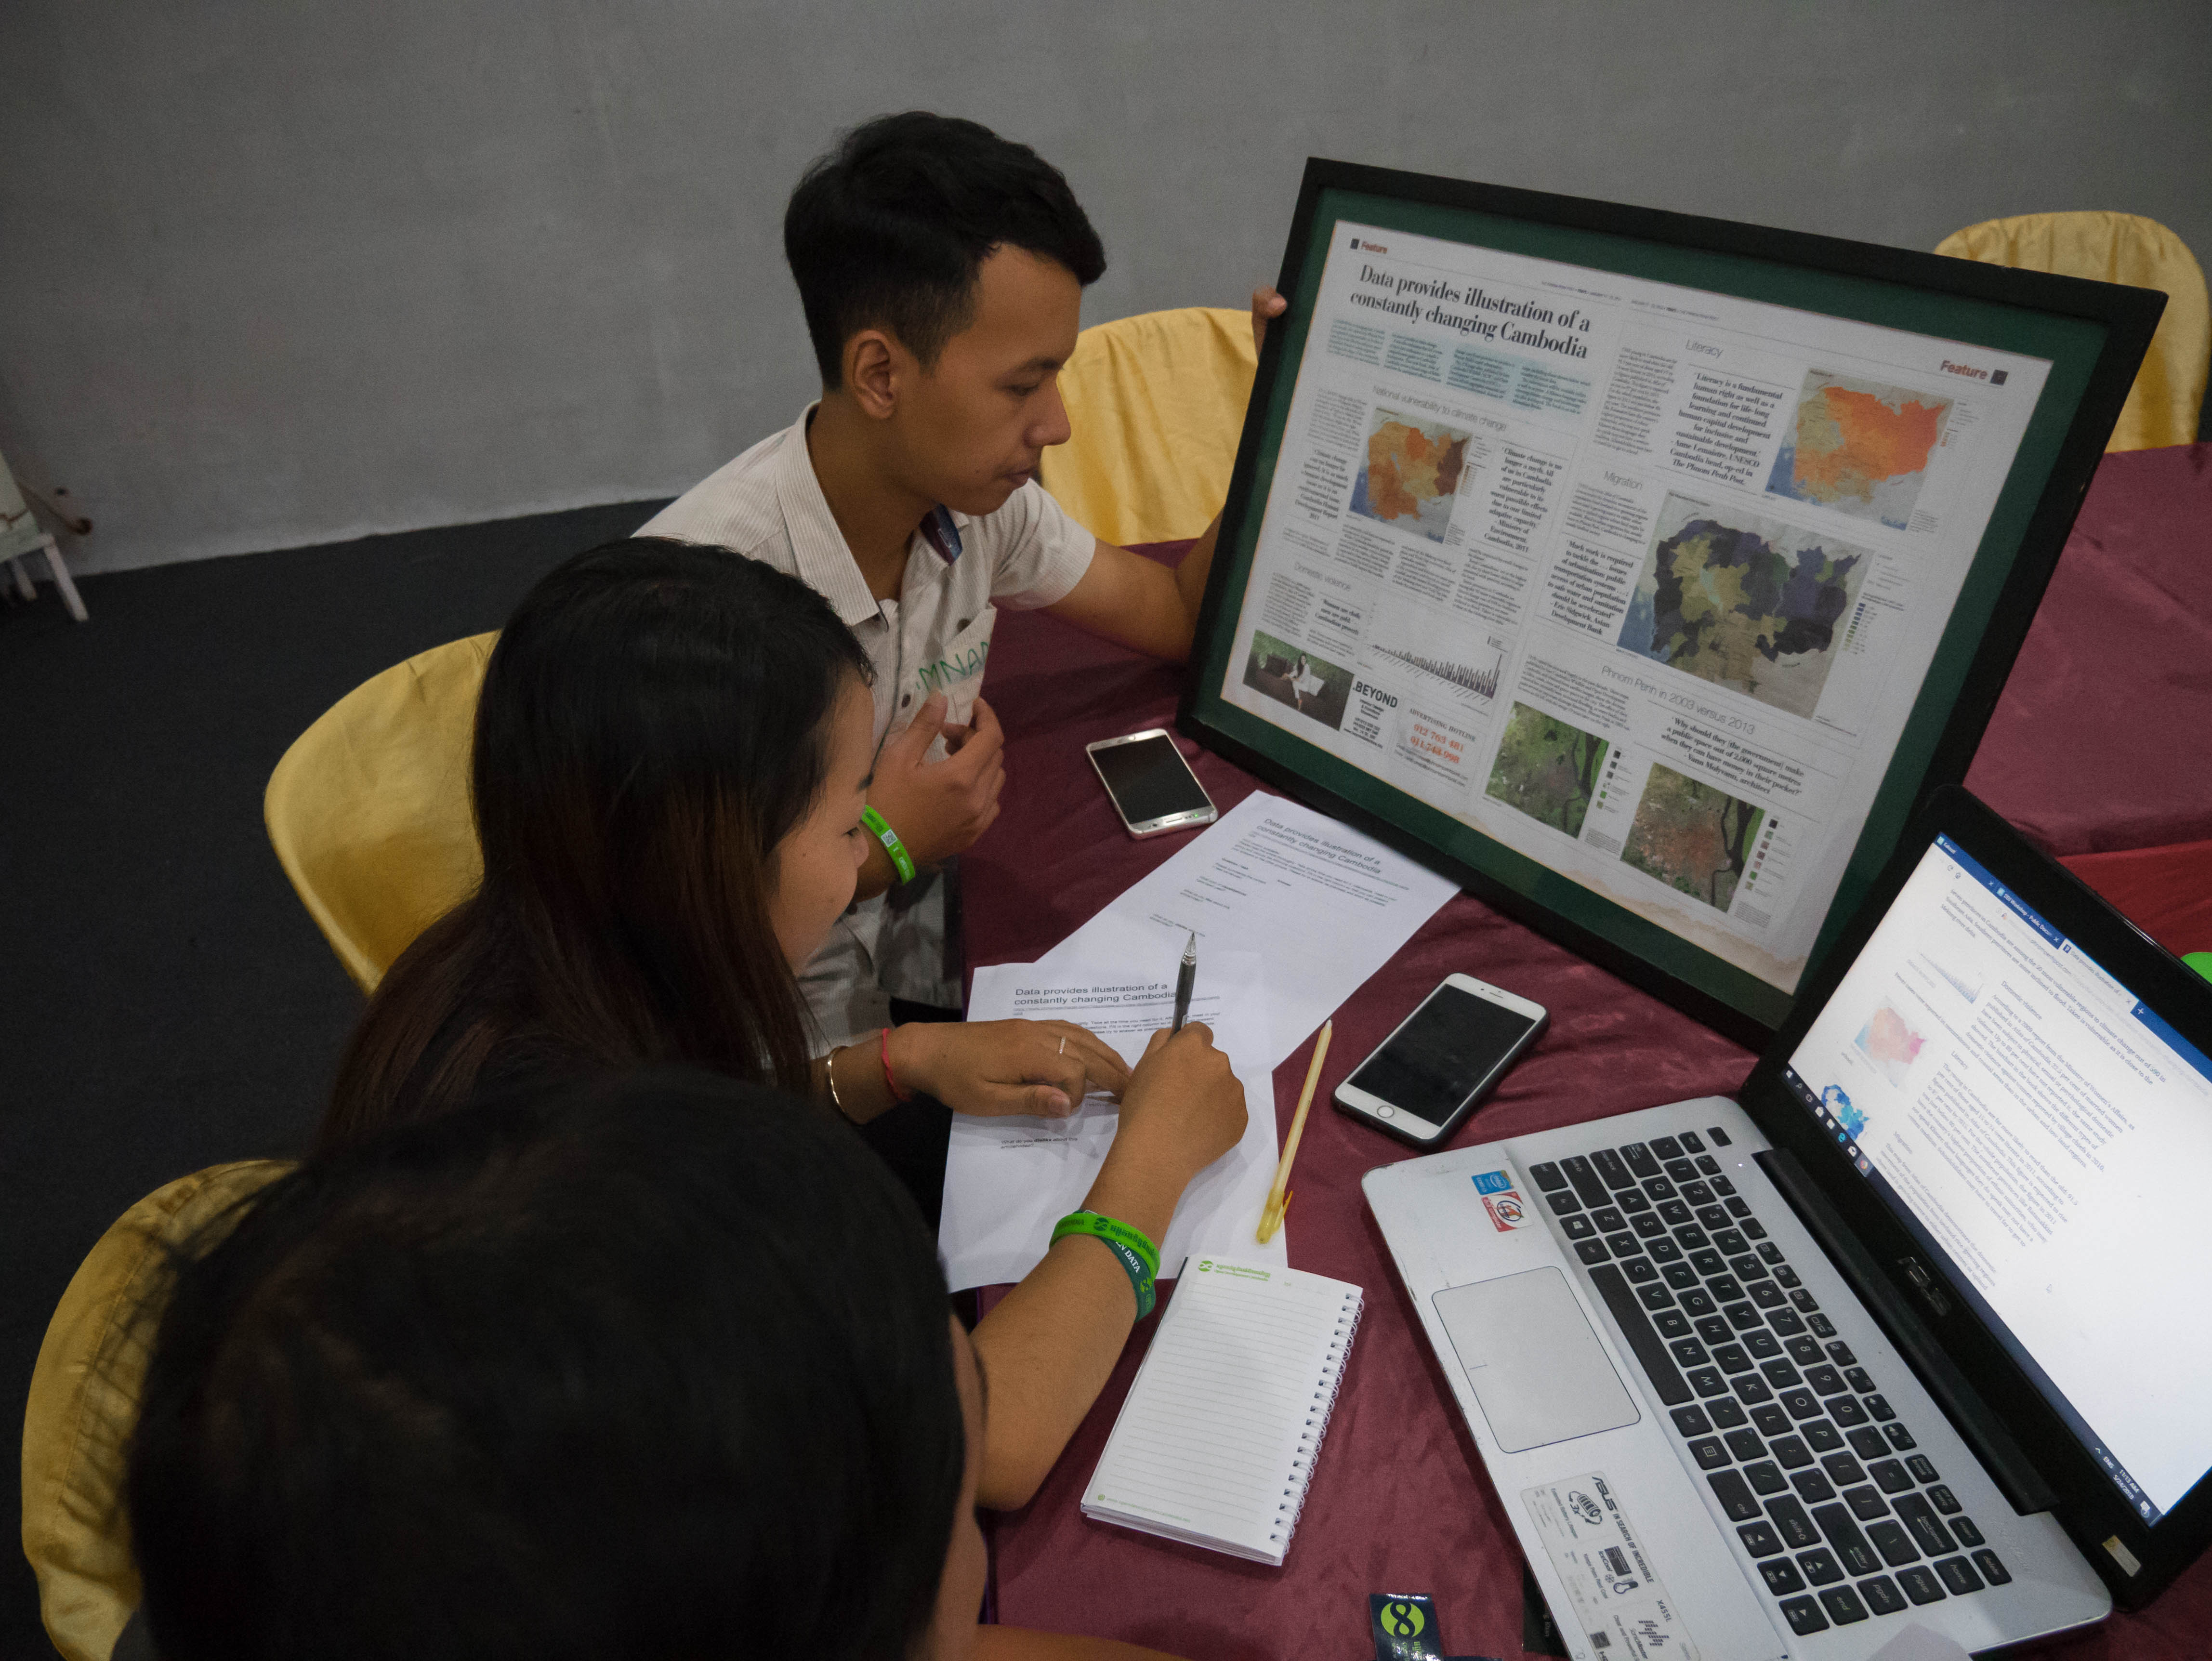
Participants are assigned to read data-driven article in group
Let´s get started!
So, let´s find the data. But where? Mr. Lennart Krotzek, media and communication intern at ODC, revealed where to find data sets online and provided insightful advice, how you can filter the data to find the best information for your story. This process takes time, but don´t give up! A very good resource to find data about Cambodia is the ODC website, for sure. Ms. Sotheavin Doch, research and partnership officer at ODC showed how easy it is to find data on ODC’s own online data hub and how you can use the interactive maps as a foundation for your own article. Provided with specific information about the structure of datasets, the participants practiced data analysis using the software SPSS which was guided by Mr. Ly Cheaty, an Operation Manager of Real-time Data Solution co., LTD.
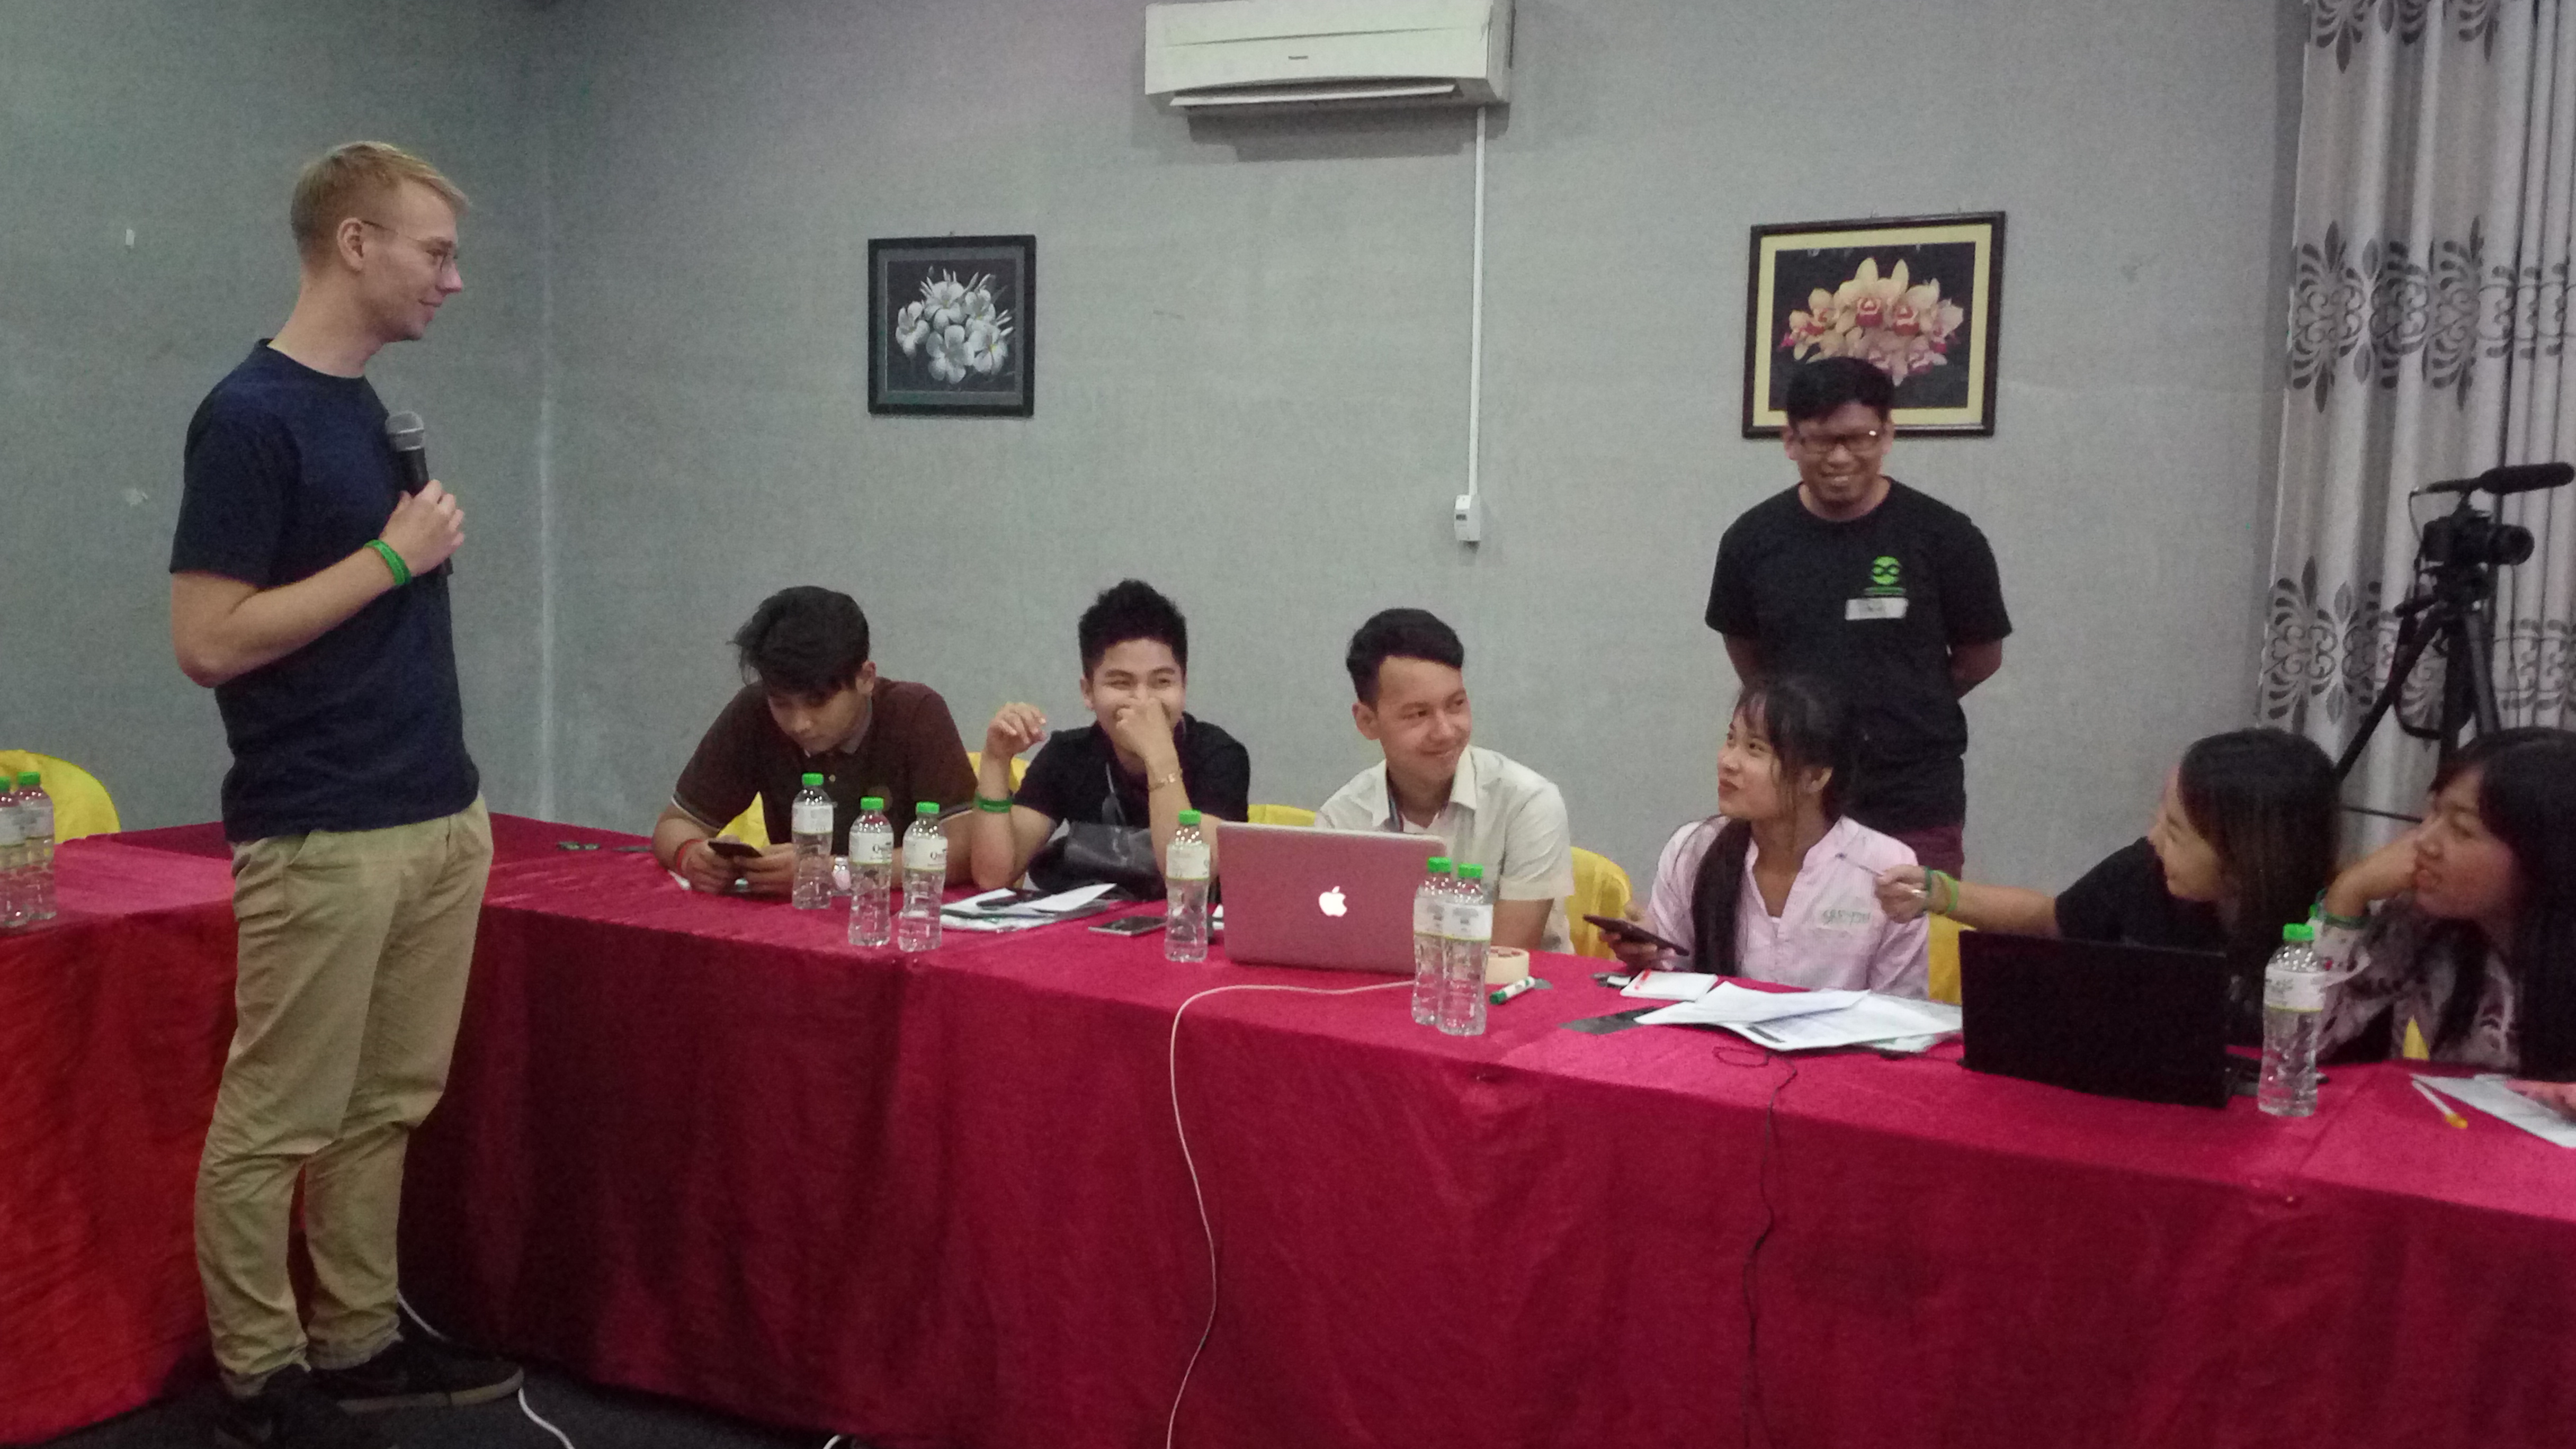
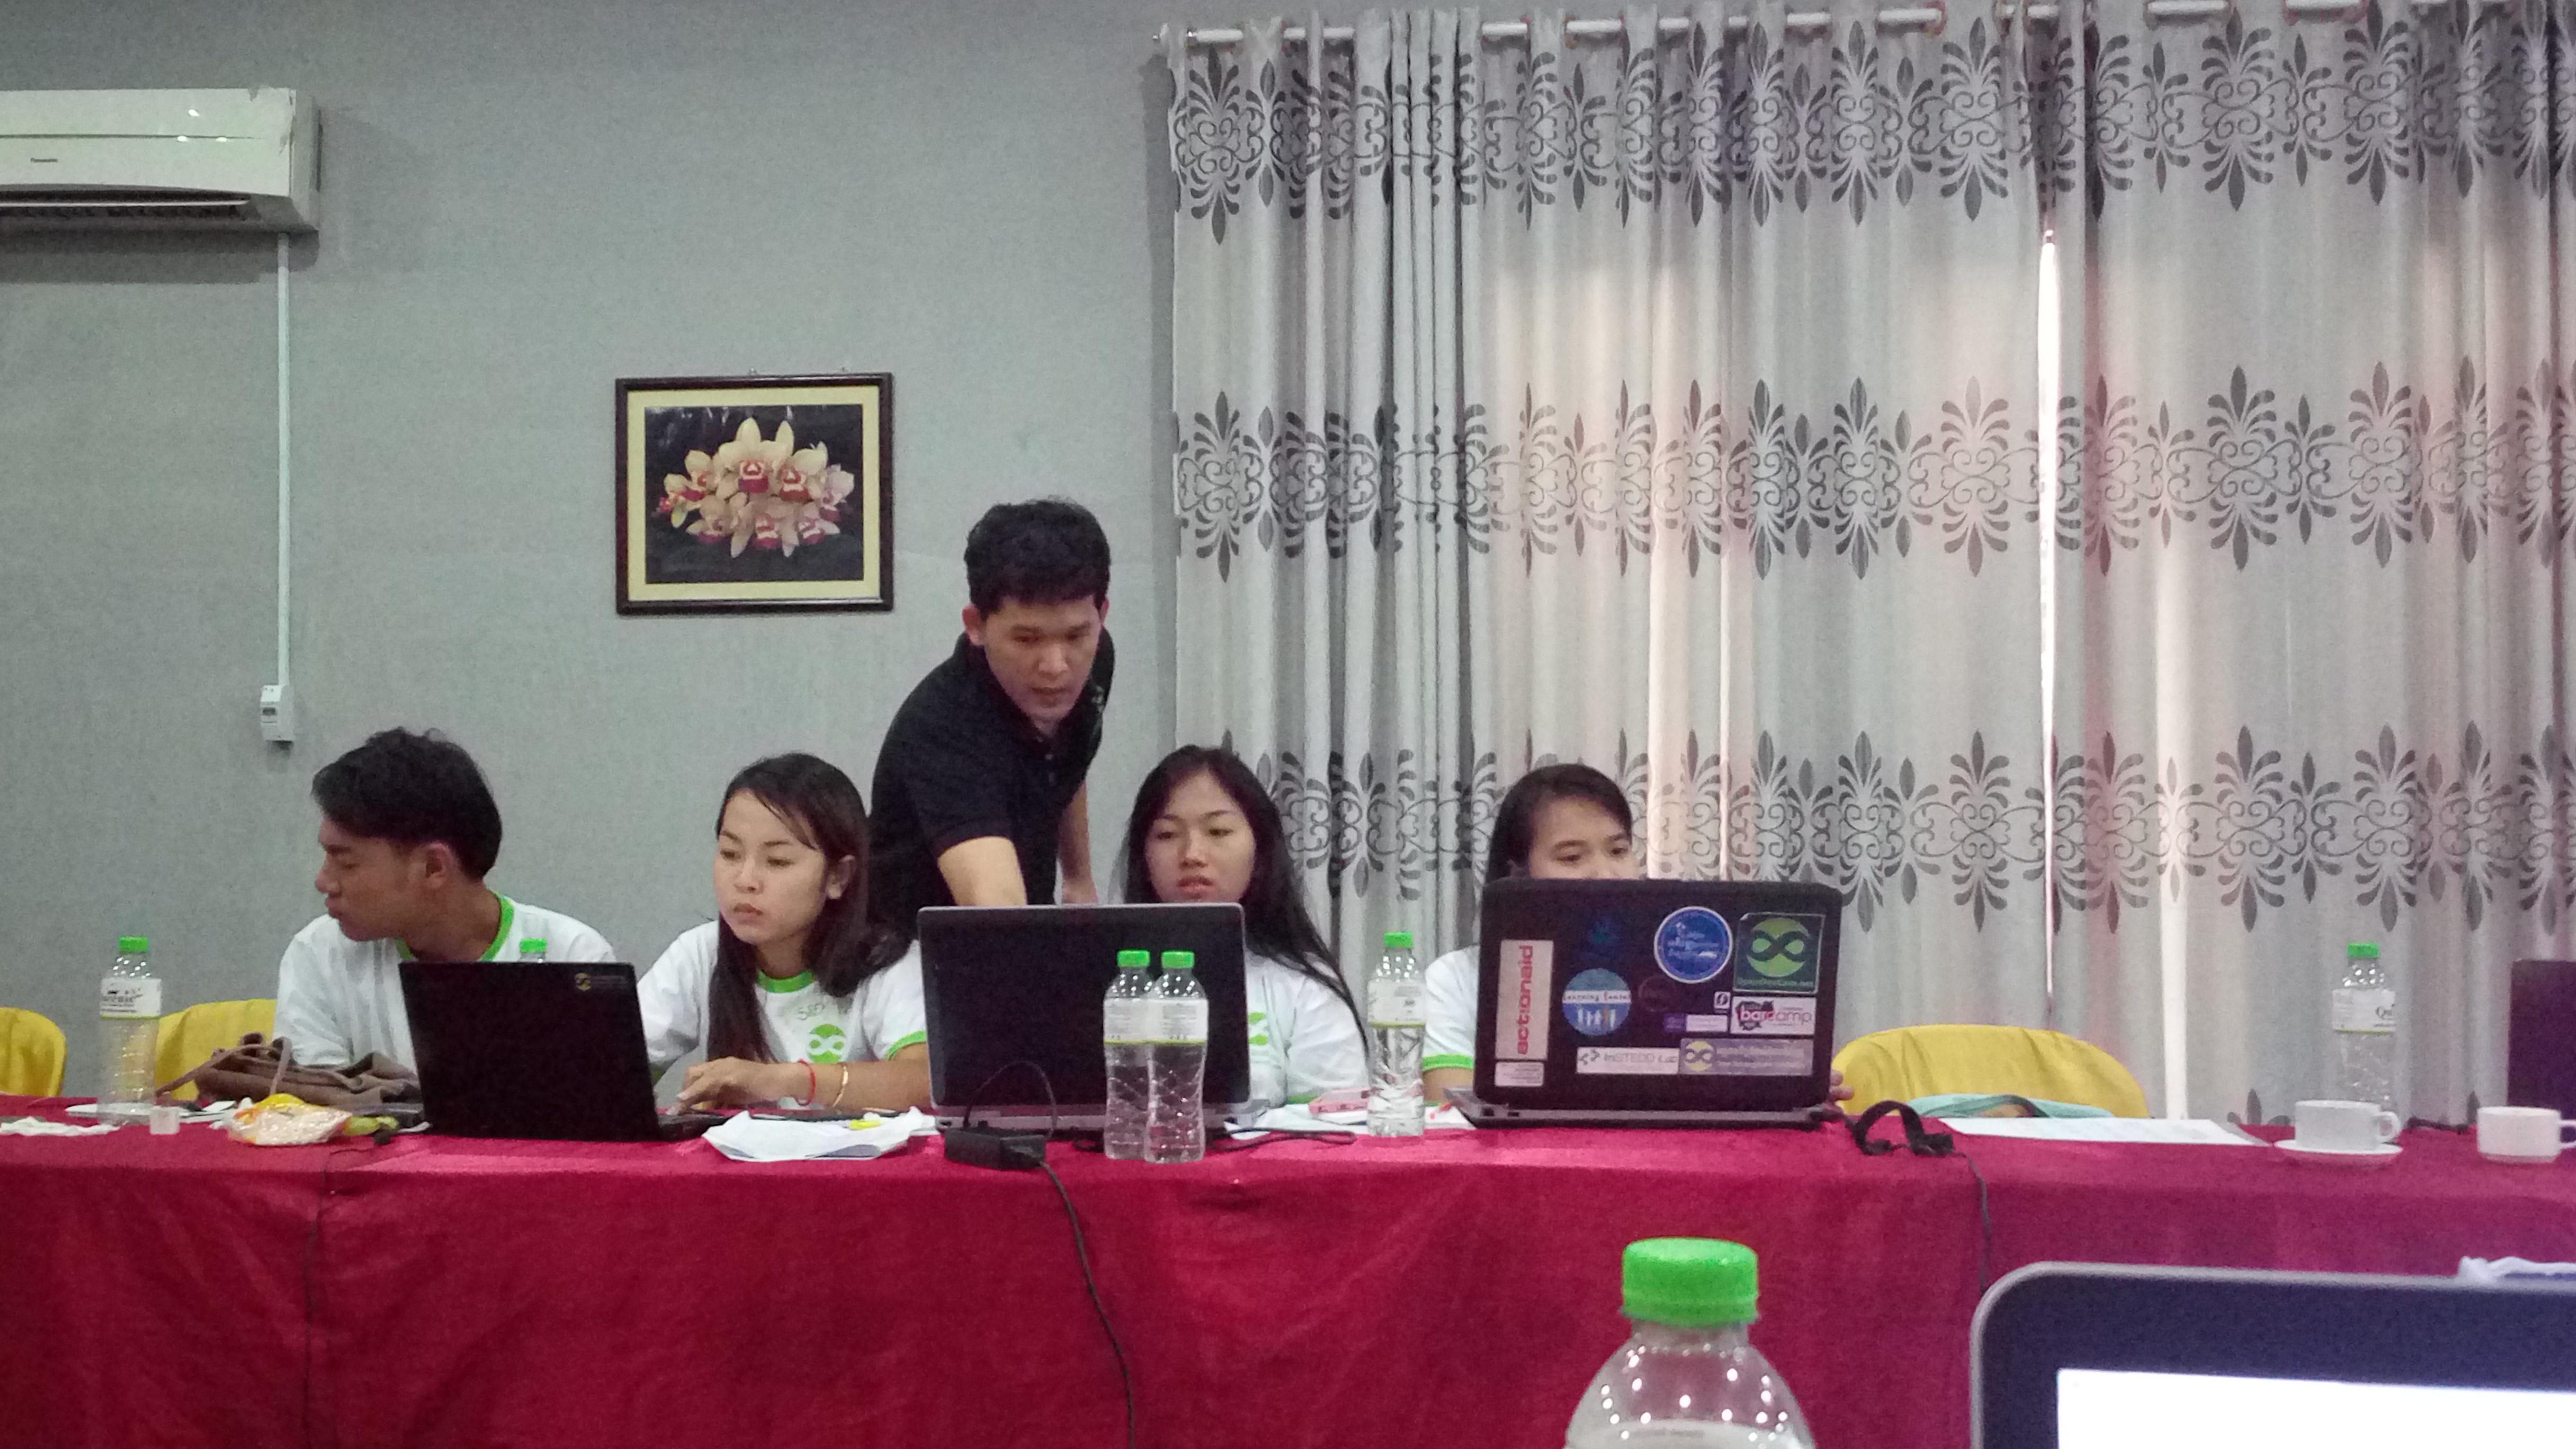
Mr. Lennart is explaining how and where participants can find the source of dataset online
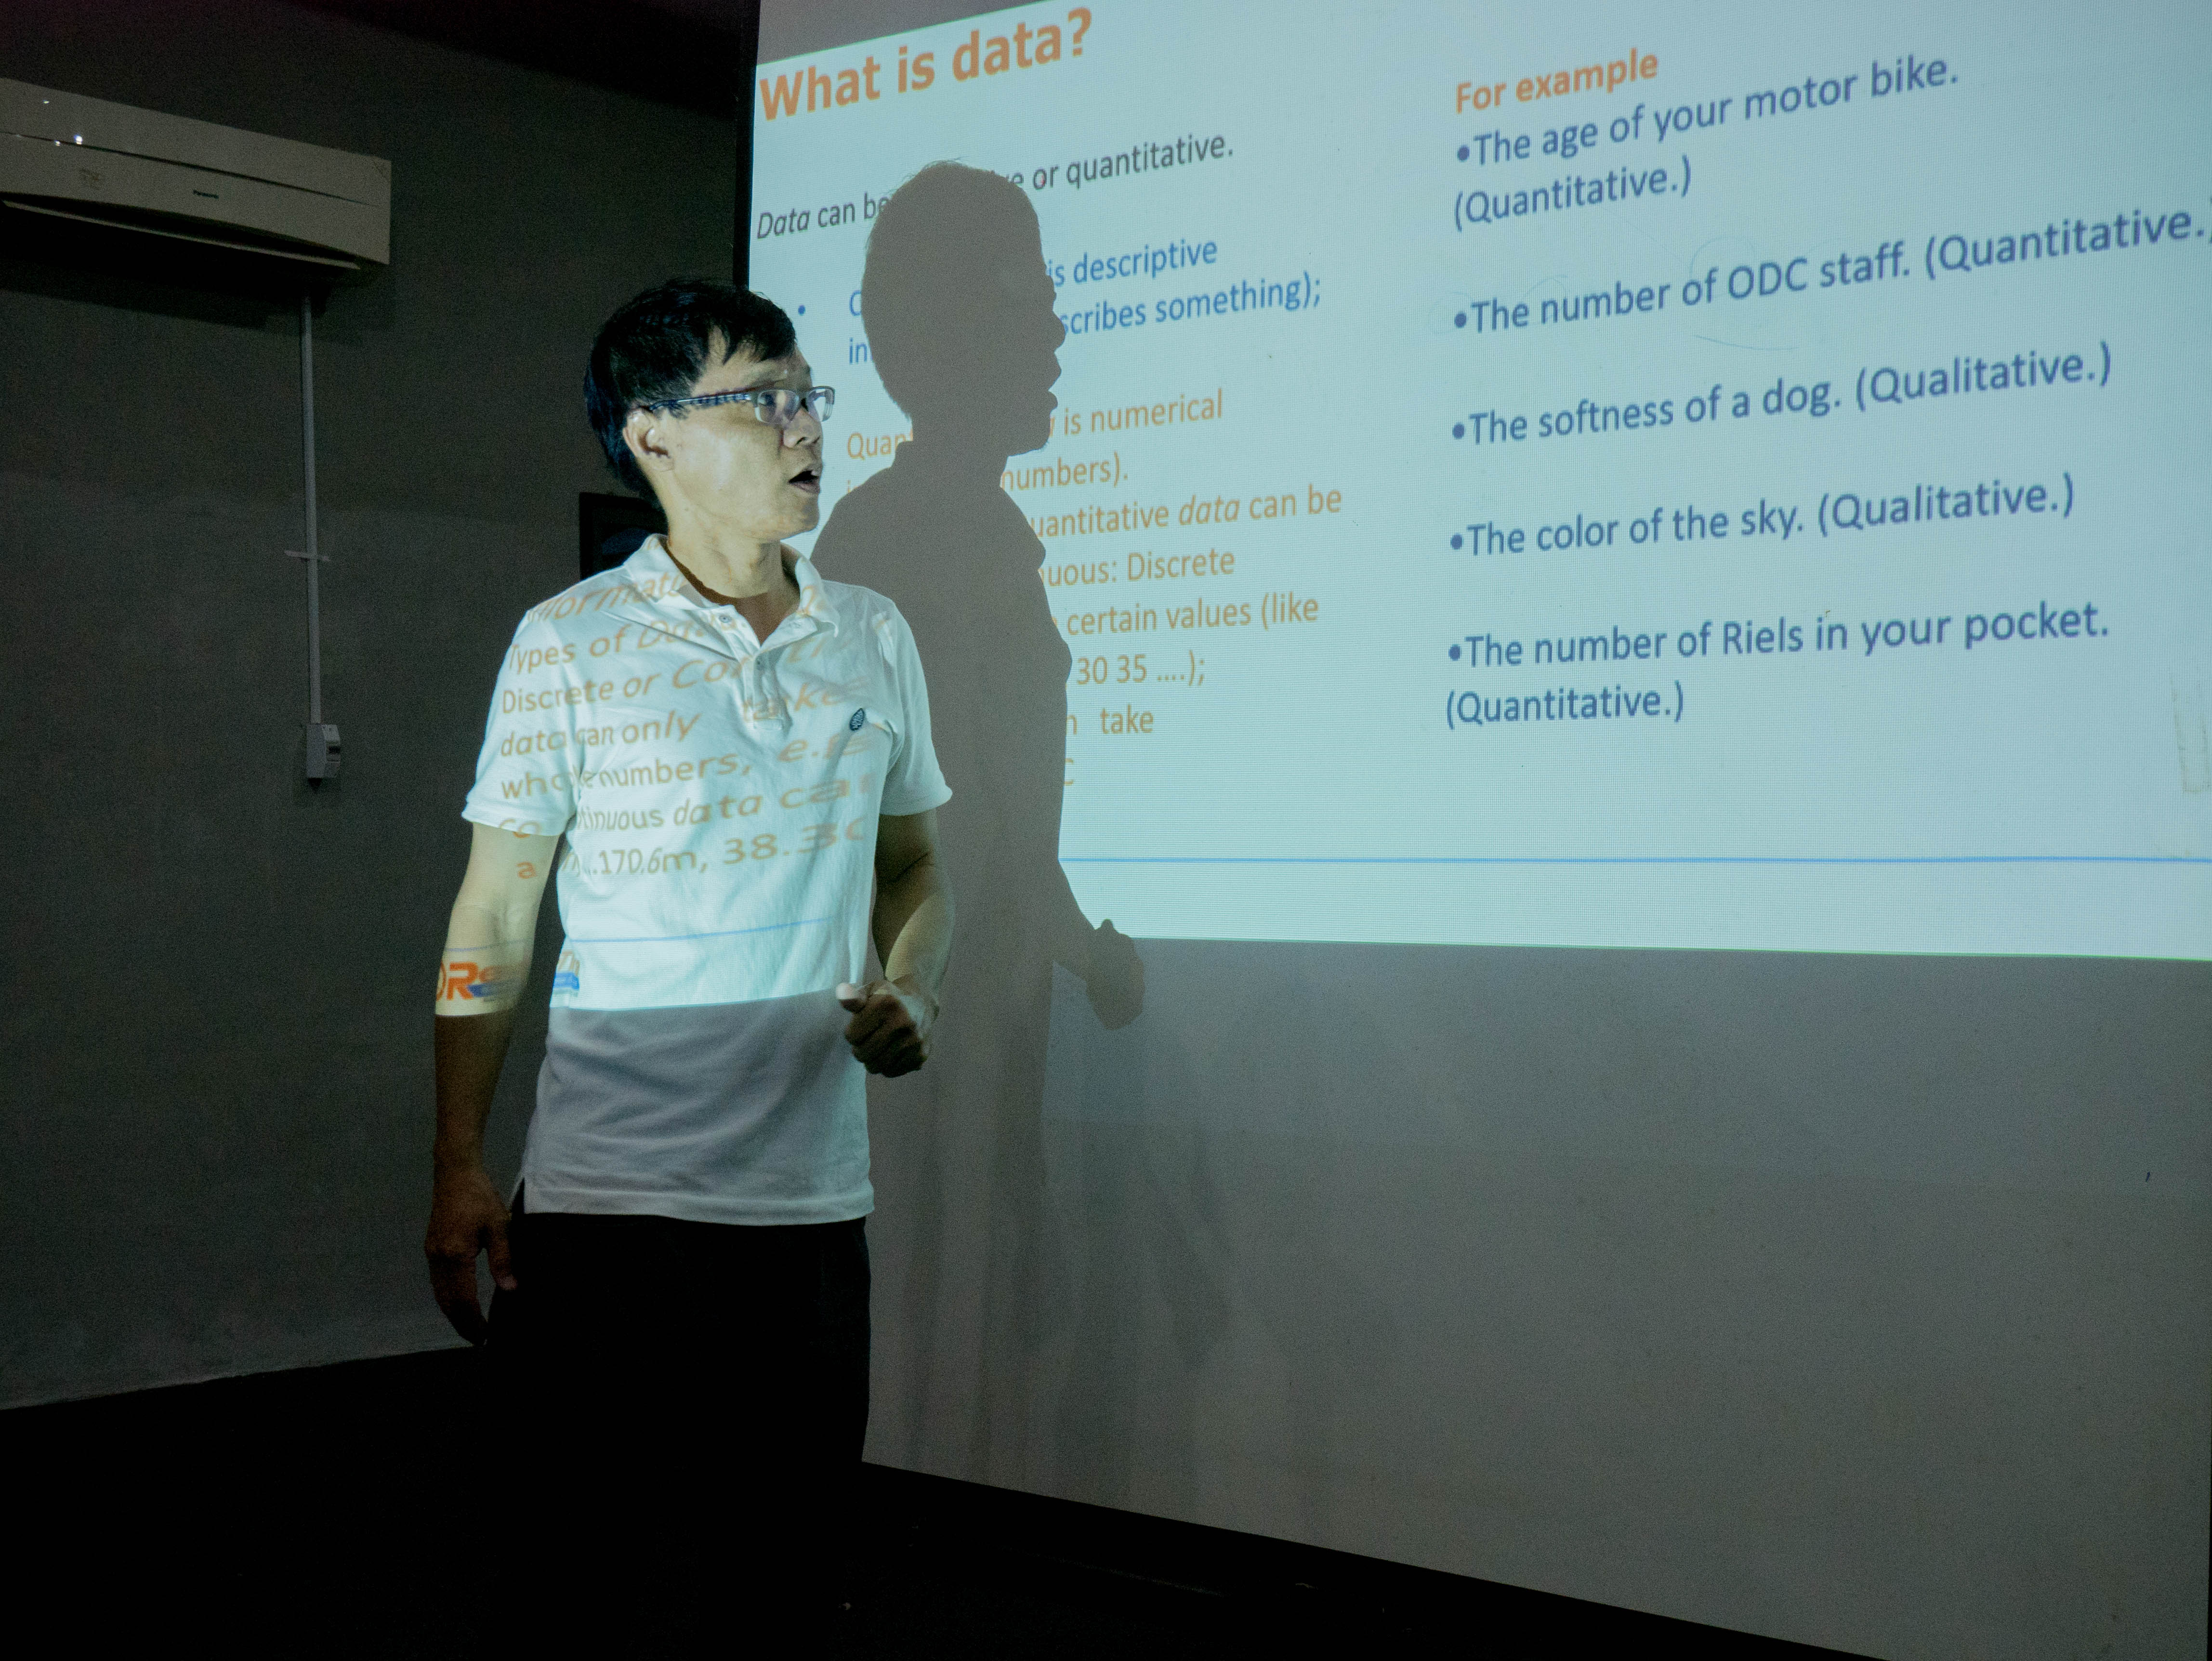
Mr. Ly Cheaty is giving instruction on using SPSS to analysis data
Data visualization: beautiful and functional
During the workshop, the members were supported to analyze and visualize a data set about education in Cambodia which was instructed by Mr. Prum Punwath, ODC’s Data Researcher and GIS Officer. But how can I choose which visualization is the best for this topic? In the end, the participants knew the do’s and don’ts of data visualization. And don´t forget: data visualizations should be beautiful, but also functional and insightful!
Mr. Prum Punwath is giving on how to do data visualization in education related sector
Writing up your news story!
When the data visualization examples were prepared by the participants, they were able to start writing their news stories using their recently prepared content. This was when Mr. Kun Chenda, CCIM’s News editor and TV producer, explained the participants how to put together data visualization and storytelling in a journalist way.
Of course, the participants went home with certificates, which prove their newly gained knowledge and skills about data-driven journalism. All were happy with the outcome of their own projects and we are very excited about all the data- driven projects, that will come up in the future!
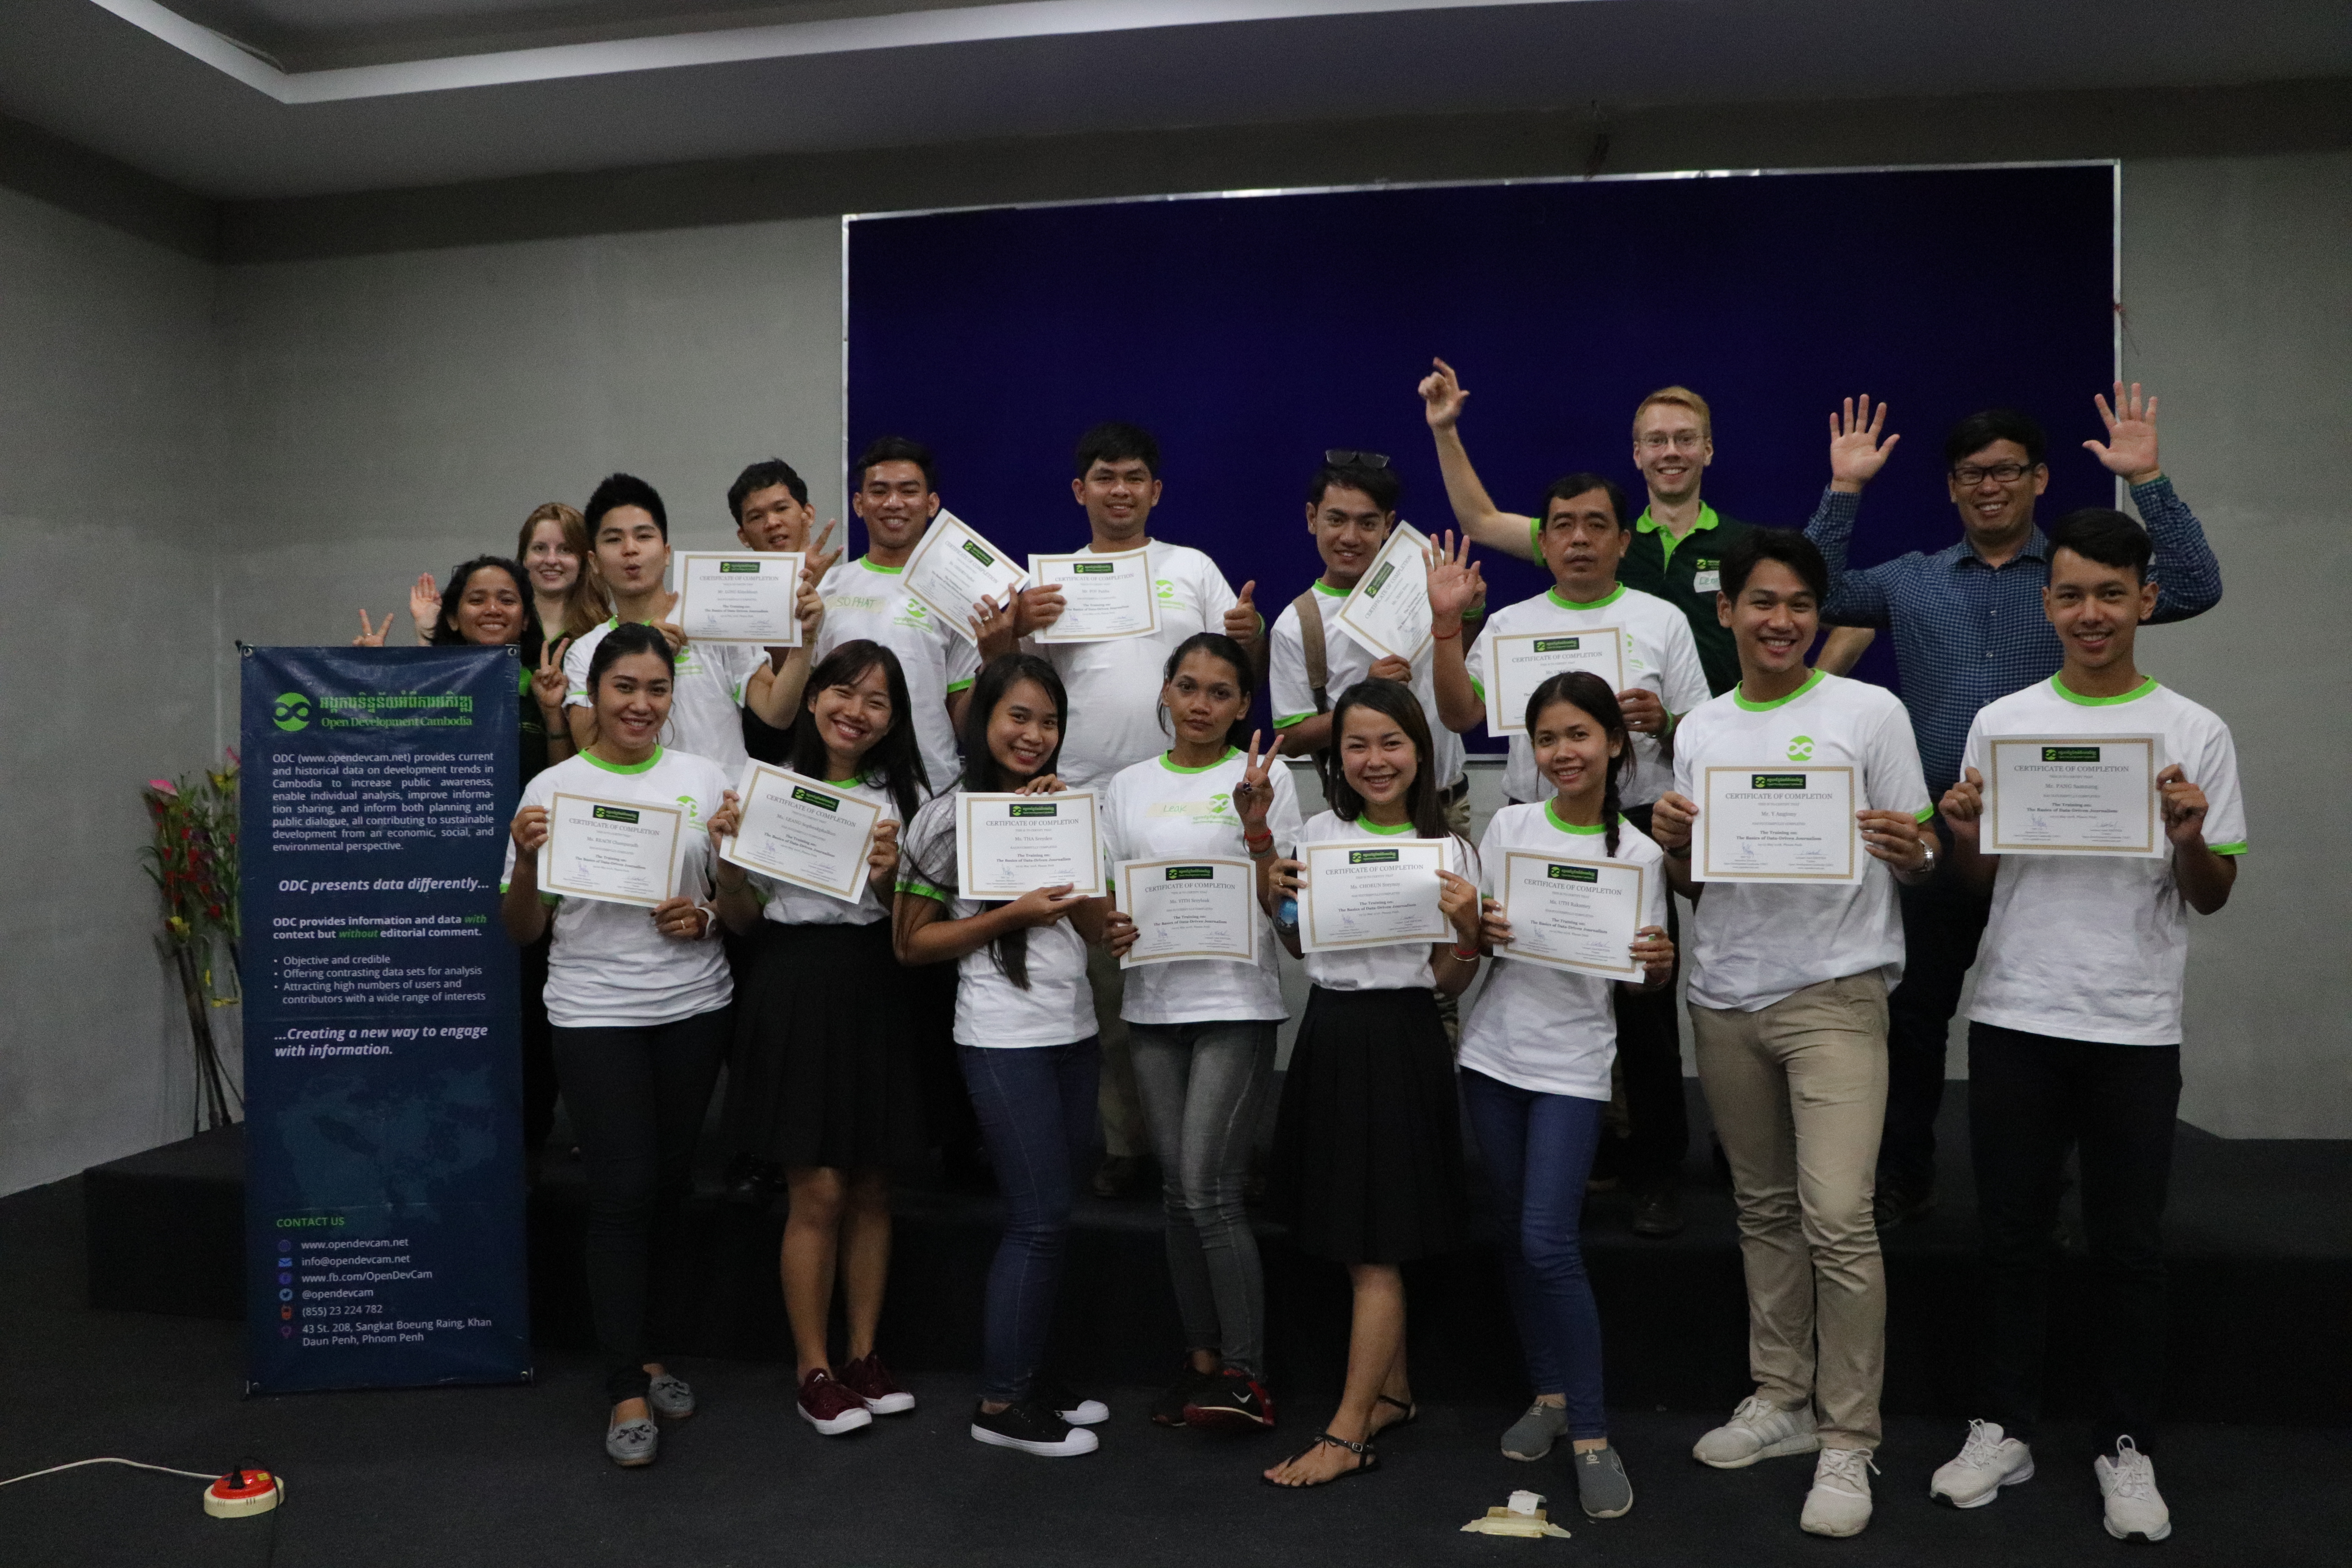
Participants got the training certificates
Do you want to read more our previous training? Here you can have a read: https://bit.ly/2Lk4QnS

