សិក្ខាសាលាបណ្តុះបណ្តាលស្តីពី មូលដ្ឋានគ្រឹះនៃអក្ខរកម្មទិន្នន័យឆ្នាំ២០២០
នៅព្រឹកថ្ងៃទី៨ ខែកញ្ញា ឆ្នាំ២០២០ អង្គការទិន្នន័យអំពីការអភិវឌ្ឍ (អូឌីស៊ី) បានរៀបចំ “សិក្ខាសាលាបណ្តុះបណ្តាលស្តីពី មូលដ្ឋានគ្រឹះនៃអក្ខរកម្មទិន្នន័យឆ្នាំ២០២០ ទាក់ទងនឹងគណនេយ្យភាពសង្គម” នៅសណ្ឋាគារប៉ូឡូវ៉ៃក្នុងរាជធានីភ្នំពេញ។ វគ្គបណ្តុះបណ្តាលរយៈពេល ៣ ថ្ងៃនេះ ស្ថិតក្រោមគម្រោង «ការច្នៃប្រឌិតថ្មីសម្រាប់គណនេយ្យភាពសង្គមនៅកម្ពុជា» ដែលមានអូឌីស៊ី និង អង្គការសុខភាពគ្រួសារអន្តរជាតិ FHI360 ជាដៃគូអនុវត្តគម្រោង ក្រោមជំនួយថវិការរបស់ មូលនិធិទីភ្នាក់ងារសហរដ្ឋអាមេរិកដើម្បីការអភិវឌ្ឍន៍អន្តរជាតិ (USAID)។ អ្នកចូលរួមប្រមាណ ២១ នាក់ (ស្រី ៩ នាក់) បានចូលរួមវគ្គបណ្តុះបណ្តាលនេះ។
ឆ្នាំនេះ អ្នកចូលរួមបានអញ្ជើញមកពីមជ្ឈដ្ឋាន និងទីកន្លែងផ្សេងៗគ្នា។ ពួកគាត់ខ្លះជាមន្ត្រីរាជាការ គ្រូបង្រៀន អ្នកសារព័ត៌មាន និងមន្ត្រីអង្គការក្រៅរដ្ឋាភិបាល ហើយមានមូលដ្ឋាននៅរាជធានីភ្នំពេញ បាត់ដំបង តាកែវ និងខេត្តកំពង់ឆ្នាំង។ ទោះបីពួកគេមកពីមជ្ឈដ្ឋាន និងខេត្តផ្សេងៗគ្នាក៏ដោយ ពួកគេមានគោលដៅតែមួយ គឺដើម្បីទទួលបានការបណ្តុះបណ្តាល និងចំណេះដឹងថ្មីៗស្តីពីអក្ខរកម្មទិន្នន័យ។
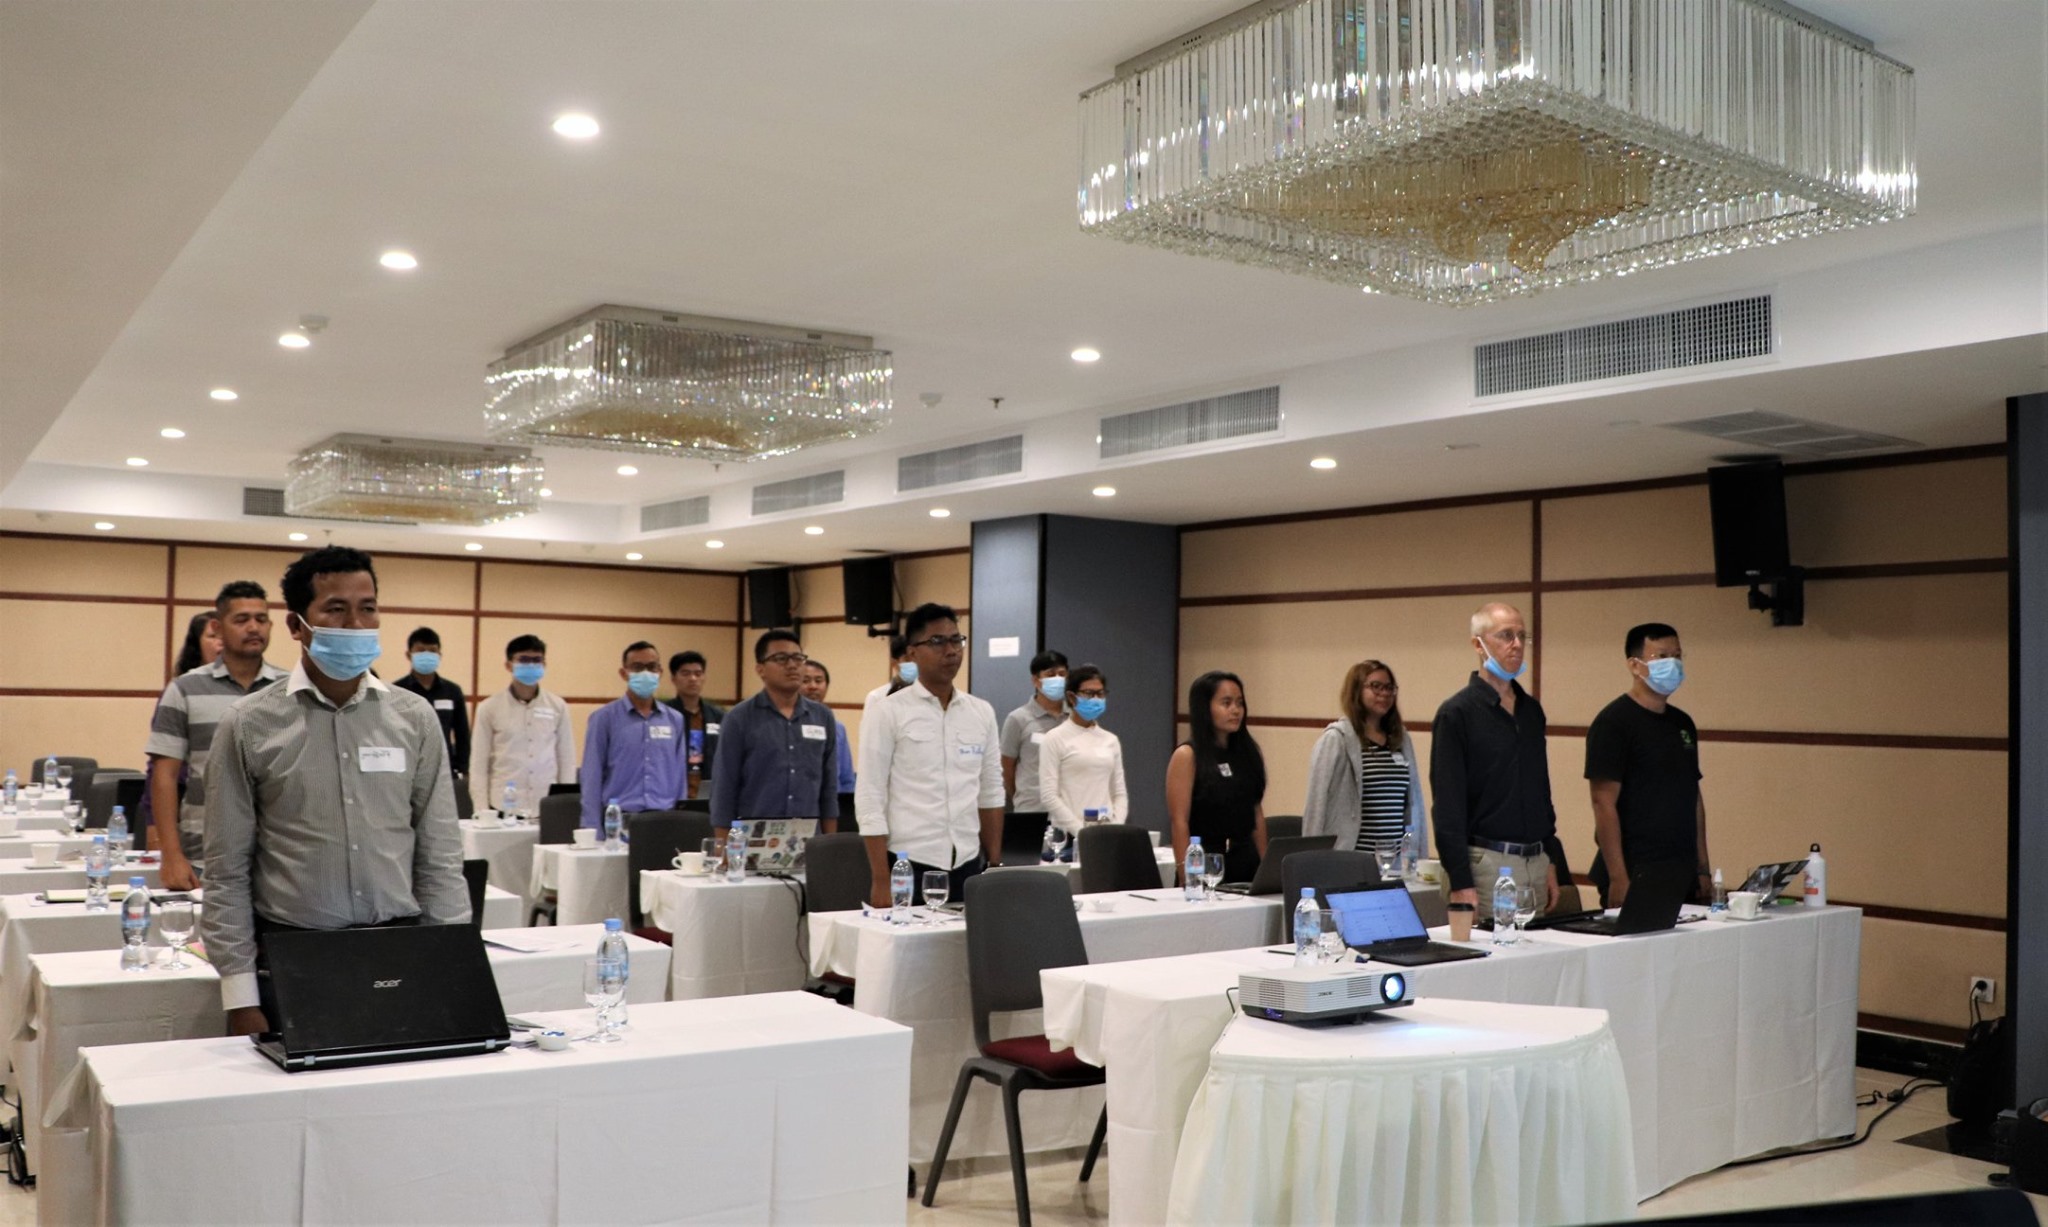
អ្នកចូលរួមទាំងអស់កំពុងគោរពភ្លេងជាតិមុនពេលបើកសិក្ខាសាលា។
គោលបំណងនៃការសិក្ខាសាលាបណ្តុះបណ្តាលស្តីពី មូលដ្ឋានគ្រឹះនៃអក្ខរកម្មទិន្នន័យឆ្នាំ២០២០ គឺផ្តល់ជូនអ្នកសារព័ត៌មាន ប្រជាពលរដ្ឋ សង្គមស៊ីវិល និងសហគមន៍បច្ចេកវិទ្យាជាមួយនឹងជំនាញជាមូលដ្ឋានក្នុងការបង្កើតរូបភាពទិន្នន័យ និងការនិទានទិន្នន័យ ដើម្បីអាចឱ្យទស្សនិកជនទូទៅទទួលបានតាមរយៈការបង្កើនការប្រើប្រាស់រូបភាពទិន្នន័យ។ គោលបំណងមួយទៀតគី ដើម្បីលើកកម្ពស់ការសម្រេចចិត្តដែលទាក់ទងនឹងគណនេយ្យភាពសង្គមនៅក្នុងប្រទេសកម្ពុជា។ ពួកគេនឹងទទួលបានបទពិសោធន៍ពីរបៀបដែលទិន្នន័យអាចត្រូវបានប្រើដើម្បីលើកកម្ពស់ដំណើរការគណនេយ្យភាពសង្គមនៅក្នុងកន្លែងធ្វើការរបស់ពួកគេ។ លើសពីនេះទៀតបន្ទាប់ពីវគ្គនីមួយៗ អ្នកចូលរួមក៏ទទួលបានបទពិសោធន៍ពីការធ្វើលំហាត់ដែលបានផ្តល់ដោយគ្រូដើម្បីអនុវត្តទ្រឹស្តីដែលពួកគេទើបតែបានរៀនផងដែរ។
ថ្ងៃទី១
លោកធី ទ្រី នាយកប្រតិបតិ្តនៃអង្គការអូឌីស៊ីបានចាប់ផ្តើមបើកវគ្គបណ្តុះបណ្តាលជាមួយនឹងសុន្ទរកថាបើកកម្មវិធី។ លោកបានសម្តែងនូវភាពសប្បាយរីករាយ និងស្វាគមន៍ចំពោះអ្នកចូលរួមទាំងអស់ក្នុងសិក្ខាសាលា។ លោកធី ទ្រីបាននិយាយថា «អក្ខរកម្មនៃទិន្នន័យគឺមានសារៈសំខាន់ណាស់នៅក្នុងពេលបច្ចុប្បន្ន។ ទិន្នន័យបើកទូលាយមានគុណសម្បត្តិជាច្រើនដែលអាចផ្តល់ឱ្យយើងនៅលើការងារប្រចាំថ្ងៃ។ លើសពីនេះទៅទៀត ការដែលមានចំណេះដឹងជាមូលដ្ឋានក្នុងការប្រើប្រាស់ទិន្នន័យតាមអ៊ីនធឺណិតក៏នឹងជួយសន្សំពេលវេលាបានច្រើនដែរ»។
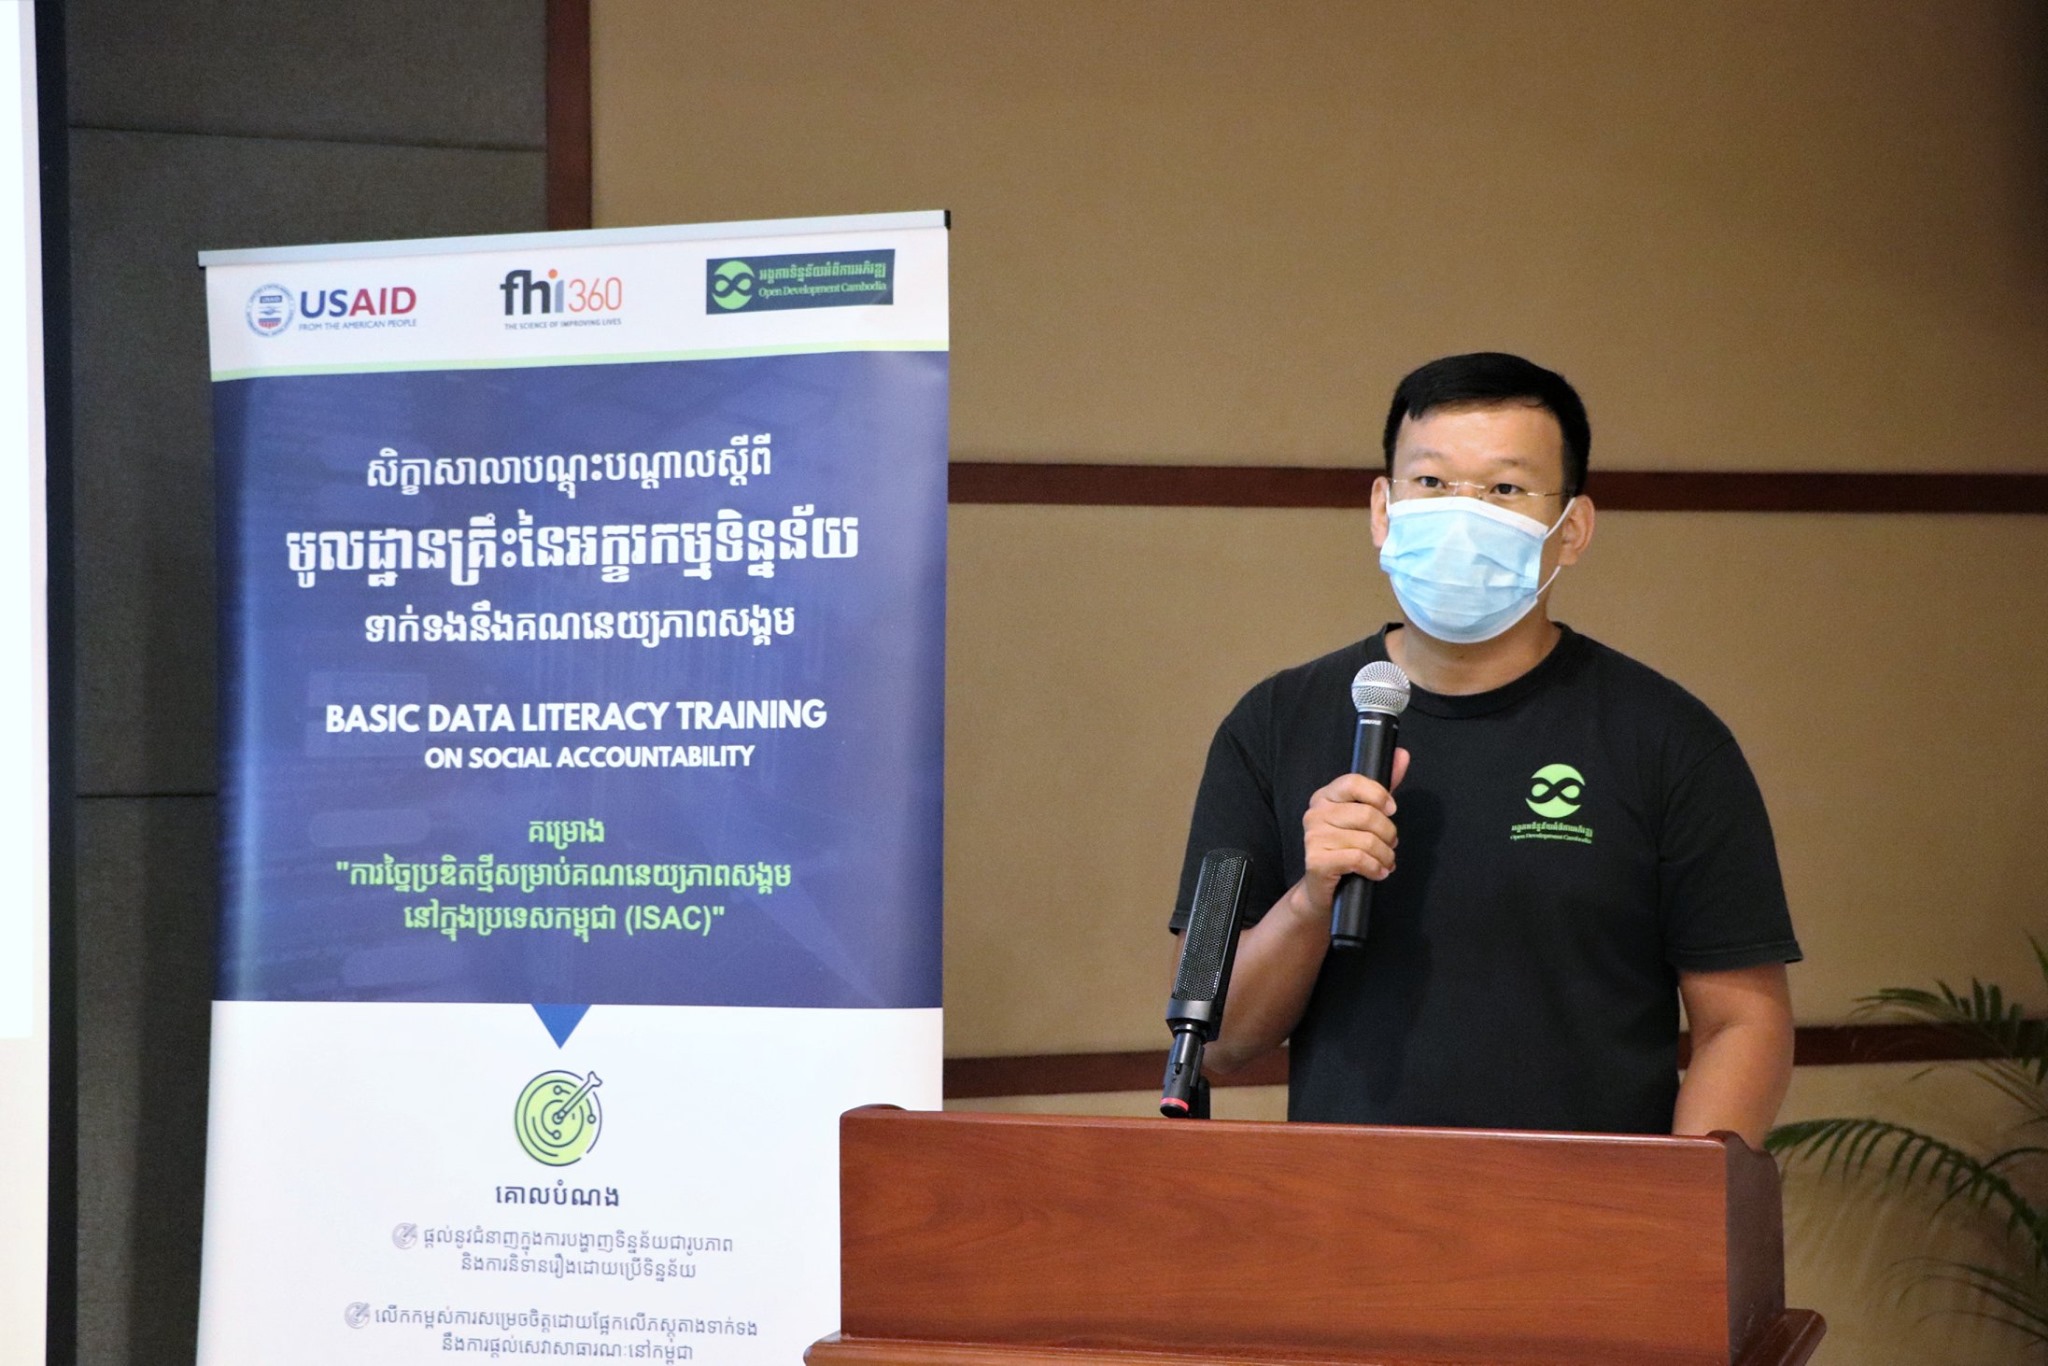
លោក ធី ទ្រី នាយកប្រតិបត្តិនៃអង្គការទិន្នន័យអំពីការអភិវឌ្ឍ (អូឌីស៊ី) កំពុងថ្លែងសុន្ទរកថាបើកកម្មវិធី។
បន្ទាប់ពីនោះ មានការថតរូបជាក្រុម ដើម្បីញ៉ាំងបរិយាកាសឱ្យកាន់តែសប្បាយរីករាយ។ បន្ទាប់មក «ការណែនាំ ស្តីពីចំណេះដឹងផ្នែកទិន្នន័យមូលដ្ឋាន» ត្រូវបានបង្រៀនដោយលោក គុណ ចិន្តា ប្រធានគ្រប់គ្រងកម្មវិធី និងមាតិការបស់អូឌីស៊ី។ វគ្គនេះបានផ្តល់ឱ្យអ្នកចូលរួមនូវមូលដ្ឋានអំពីអក្ខរកម្មទិន្នន័យ និងគណនេយ្យភាពសង្គម។ គោលដៅ អត្ថប្រយោជន៍ ការរំពឹងទុក និងទិដ្ឋភាពទូទៅនៃវគ្គបណ្តុះបណ្តាលរយៈពេលបីថ្ងៃនេះ ក៏ត្រូវបានពិភាក្សាផងដែរ។
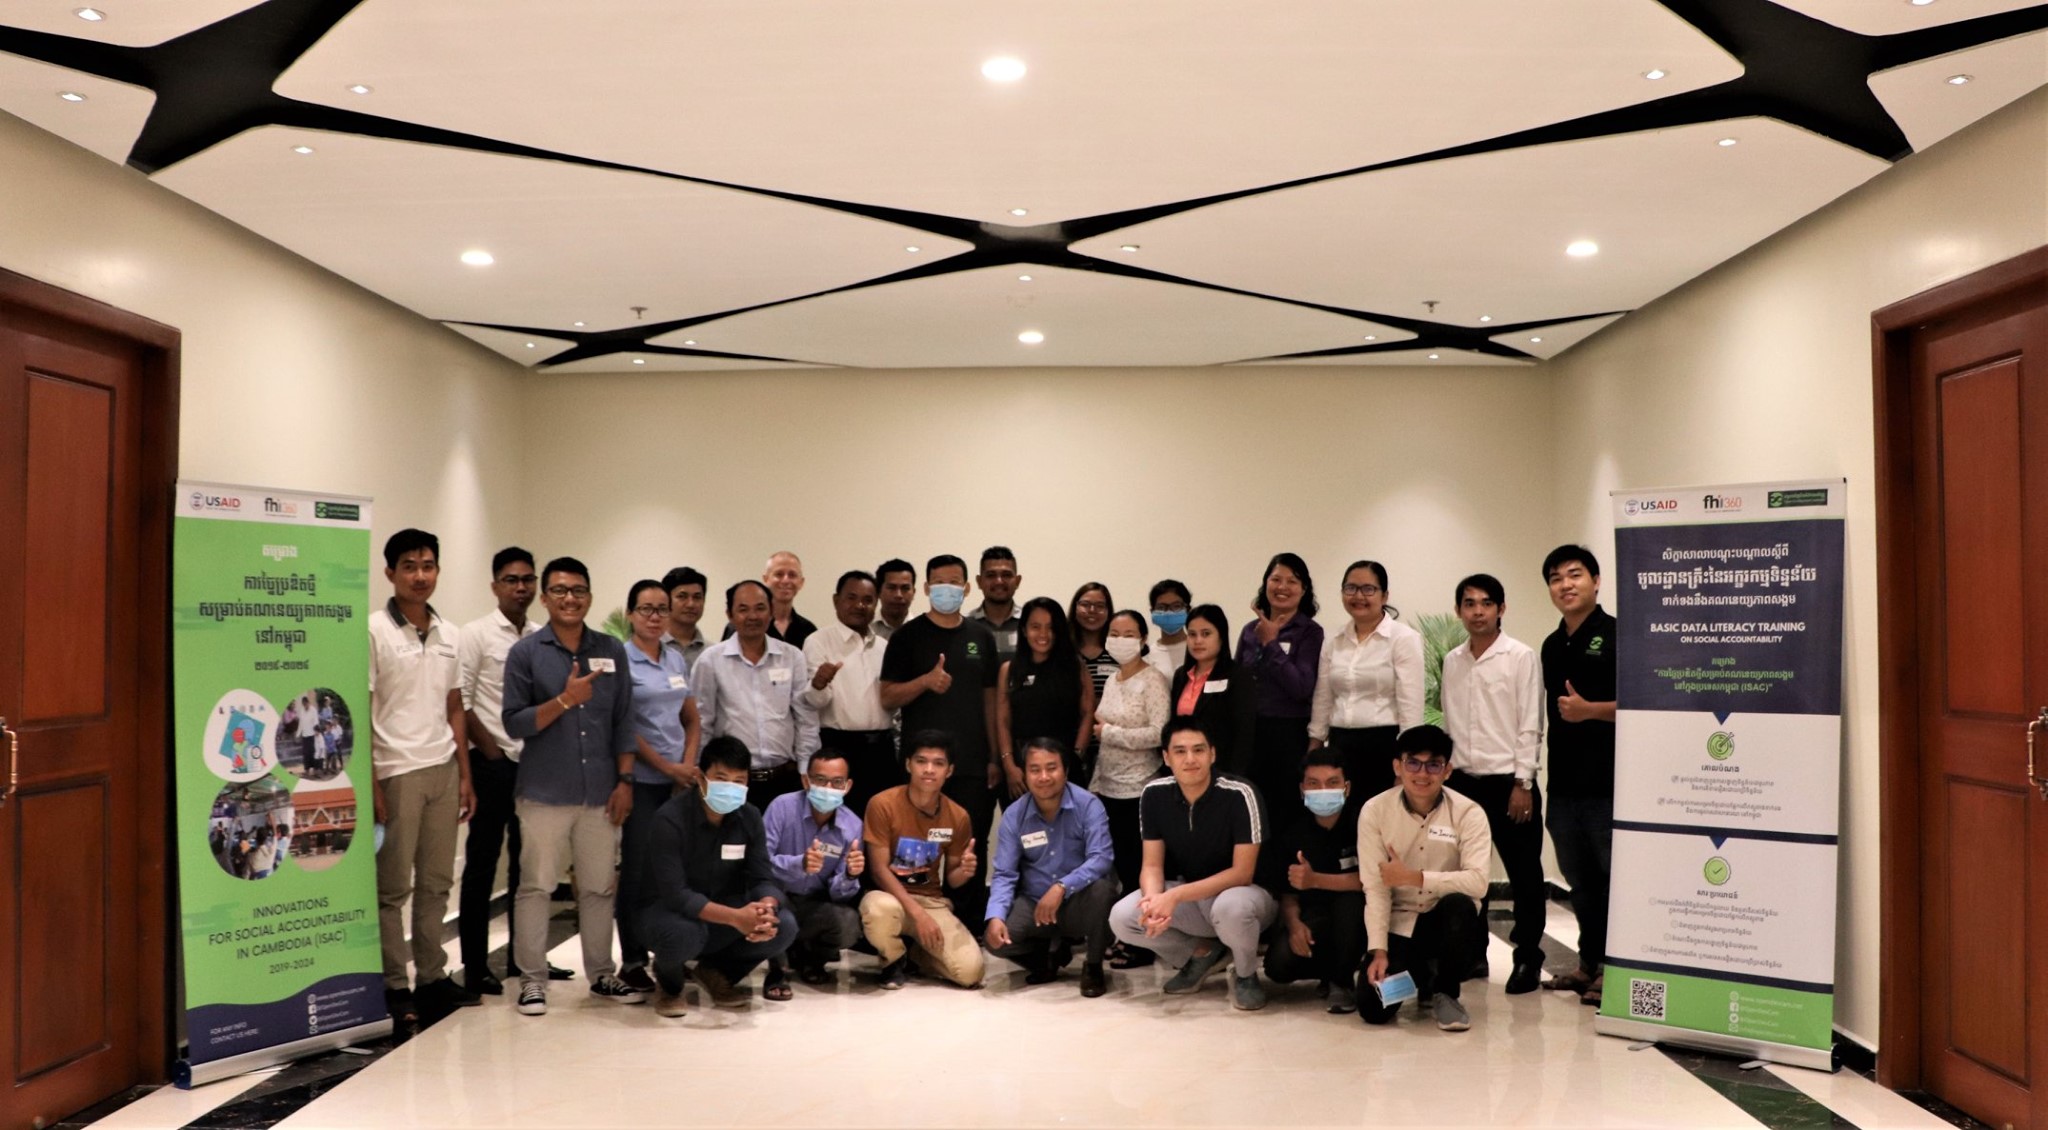
រូបថតជាក្រុម
វគ្គបន្ទាប់គឺ ទម្រង់នៃទិន្នន័យ។ លោក វង្ស ពិសិទ្ធ អ្នកបង្រៀនដ៏ចំណានម្នាក់របស់អូឌីស៊ីលើការស្រាវជ្រាវទិន្នន័យ និងកម្មវិធី GIS បានបង្ហាញពីទម្រង់ទិន្នន័យផ្សេងៗគ្នាដល់អ្នកចូលរួម។ ការបង្រៀននេះមានសារៈសំខាន់ណាស់ក្នុងការស្វែងយល់អំពីទិន្នន័យ។ ប្រភេទ និងទម្រង់ទិន្នន័យផ្សេងគ្នា ត្រូវបានលើកឡើង ហើយមុខងារ និងគោលបំណងរបស់ទិន្នន័យទាំងនោះត្រូវបានសង្ខេប។ បន្ទាប់ពីអាហារថ្ងៃត្រង់ ការបង្រៀនអំពី វិធីស្វែងរកទិន្នន័យតាមអ៊ីនធឺណិត និងការស្វែងរកតាម Advance Google Search ត្រូវបានបង្ហាញ។ វគ្គនេះនិយាយអំពីការជ្រើសរើសប្រភពដែលអាចទុកចិត្តបាន និងបច្ចេកទេសមួយចំនួនដើម្បីធ្វើការស្រាវជ្រាវតាមអ៊ីនធឺណិតឱ្យបានលឿន និងត្រឹមត្រូវ។ លោក បាន ចន្ទផល្លា អ្នកបង្រៀនវគ្គនេះលើកឡើងថា «នៅពេលនិយាយអំពីទិន្នន័យ ការពិចារណាពីភាពទុកចិត្តបាននៃប្រភពនៃទិន្នន័យមានសារៈសំខាន់ប្រហាក់ប្រហែលទៅនឹងការប្រមូលទិន្នន័យដូច្នេះដែរ។»
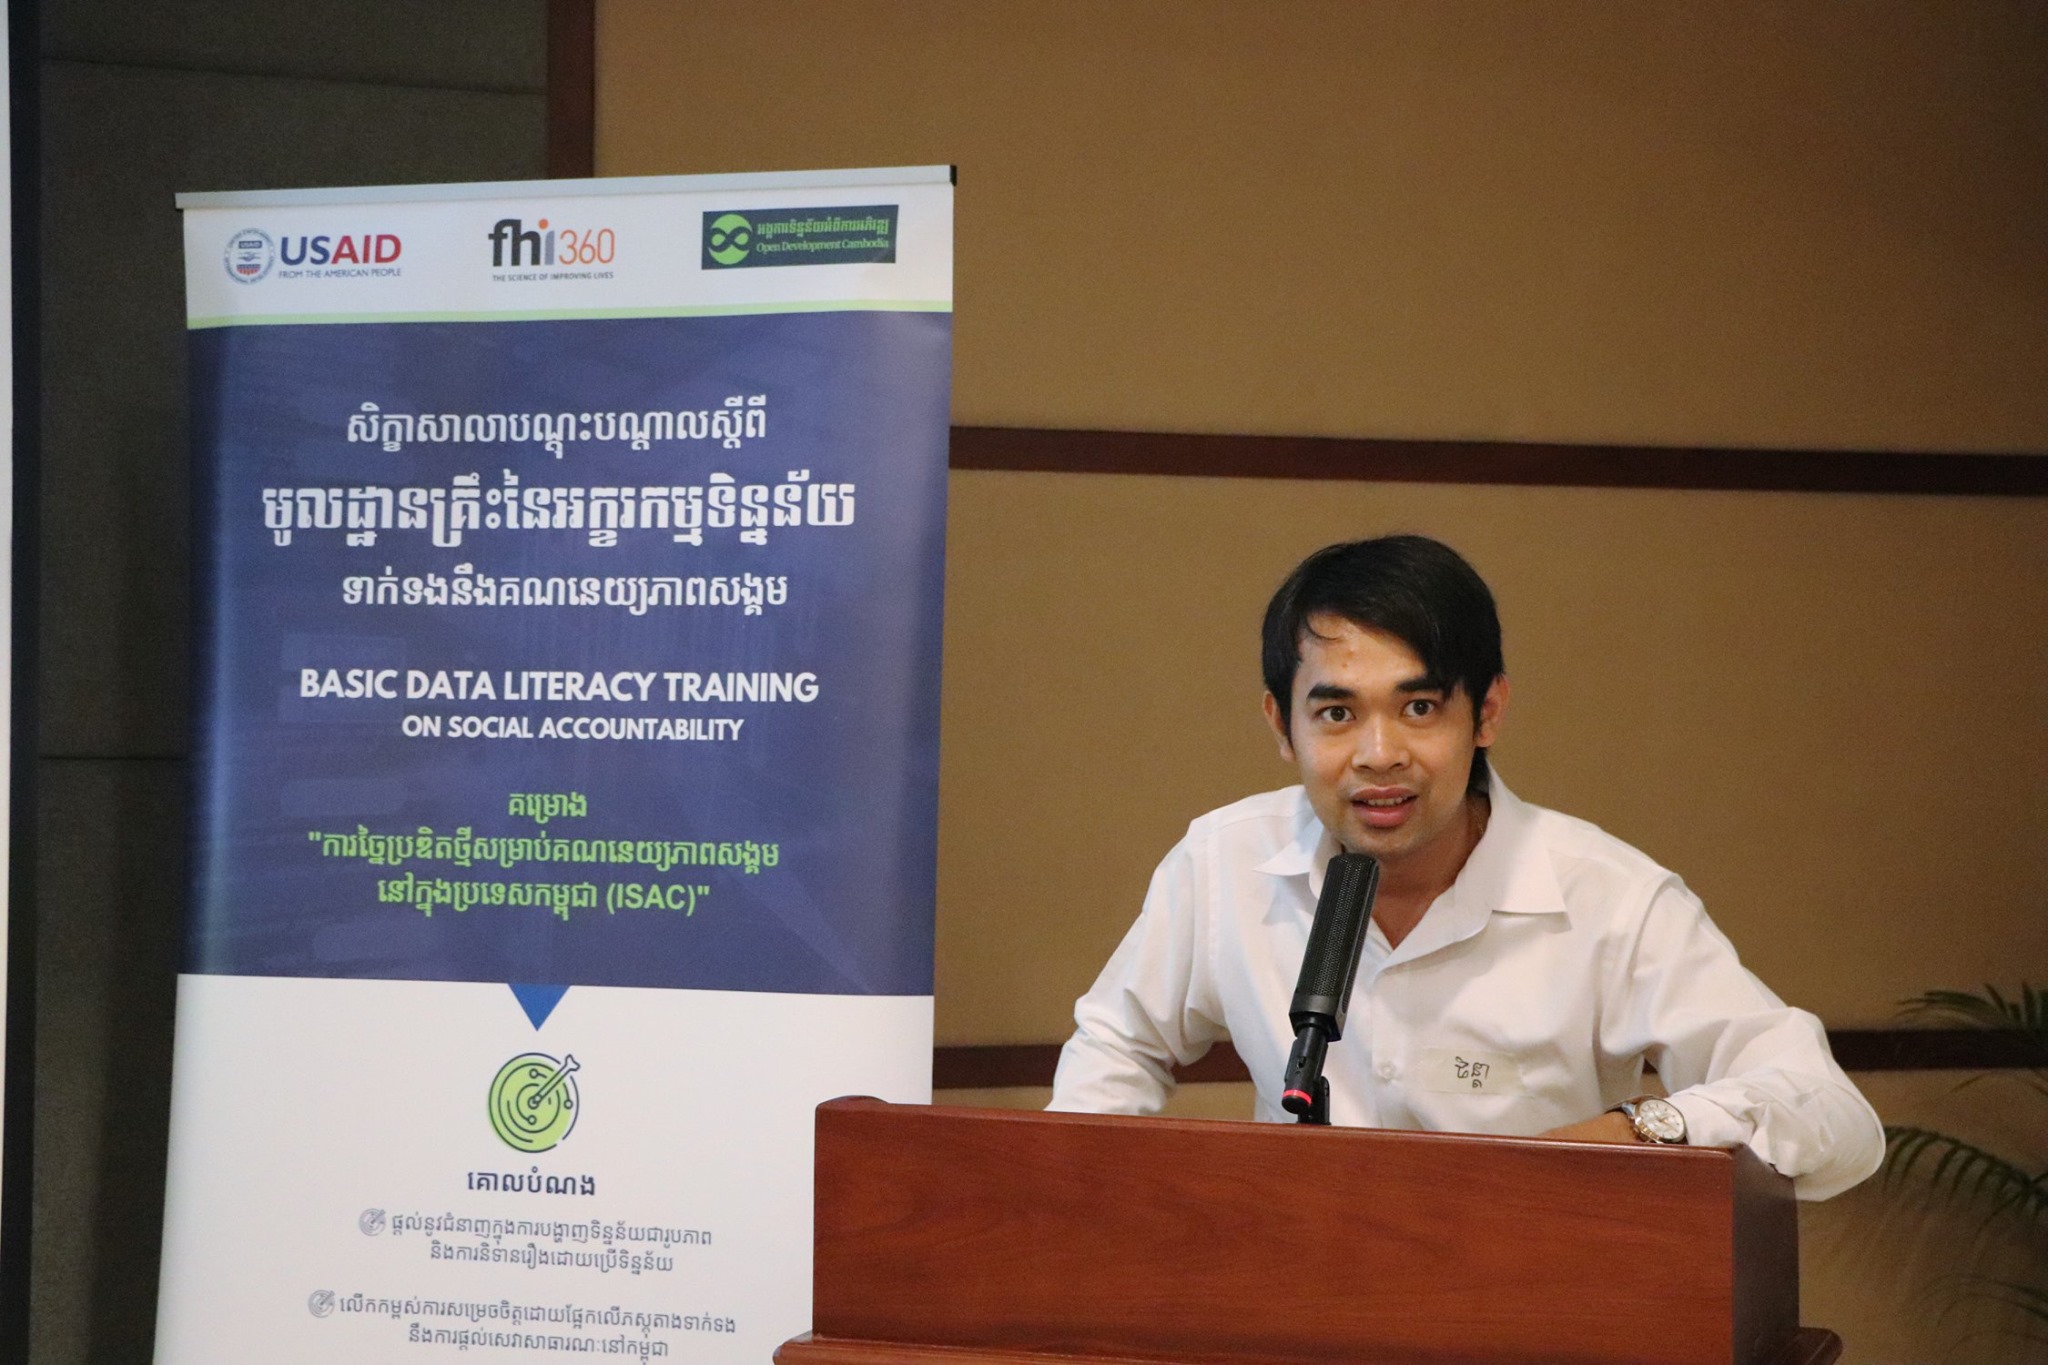
លោក គុណ ចិន្តា ប្រធានគ្រប់គ្រងកម្មវិធី និងមាតិការបស់អូឌីស៊ី កំពុងធ្វើបទបង្ហាញ។
មុនបញ្ចប់ថ្ងៃទី១ កញ្ញា អ៊ួន វិមល និងលោក ឡុច កល្យាណបានធ្វើបទបង្ហាញស្តីពី «ការណែនាំអំពីគេហទំព័រទិន្នន័យ និងមូលដ្ឋាននៃការរៀបចំទិន្នន័យ (PDF) និងការណែនាំអំពីកម្មវិធី Khmer OCR»។ វគ្គទាំងនេះផ្តល់ឱ្យអ្នកចូលរួមនូវចំណេះដឹងទូទៅលើមូលដ្ឋានទិន្នន័យតាមអ៊ីនធឺណិត និងដំណើរការនៃការកាត់ទិន្នន័យដោយប្រើប្រាស់កម្មវិធី Khmer OCR។ លោកកល្យាណក៏បានបង្រៀនអ្នកចូលរួមអំពីរបៀបបំប្លែងឯកសារទៅជាទម្រង់ផ្សេងៗគ្នាផងដែរ។
ថ្ងៃទី២ និងទី៣
ថ្ងៃទី២ និងថ្ងៃបញ្ចប់នៃសិក្ខាសាលាបណ្តុះបណ្តាលស្តីពី មូលដ្ឋានគ្រឹះនៃអក្ខរកម្មទិន្នន័យឆ្នាំ២០២០ មានគោលបំណងផ្តល់ឱ្យអ្នកចូលរួមនូវការយល់ដឹងកាន់តែស៊ីជម្រៅអំពីអក្ខរកម្មទិន្នន័យជាពិសេសគូសបញ្ជាក់ពីការណែនាំអំពីទម្រង់ទិន្នន័យ បទបង្ហាញទិន្នន័យ និងវិធីធ្វើទិន្នន័យជារូបភាព។ អ្នកចូលរួមត្រូវបានគេរំពឹងថានឹងរៀនពីការរចនាទិន្នន័យផ្ទាល់ខ្លួនដែលមានអត្ថប្រយោជន៍សំរាប់ជីវិតប្រចាំថ្ងៃរបស់ពួកគេ។ លោក គុណ ចិន្តា និងលោក វង្ស ពិសិទ្ធ ជាទទួលបន្ទុកវគ្គទាំងនេះ។
ក្រាបប្រភេទផ្សេងៗគ្នាត្រូវបានណែនាំនៅក្នុងវគ្គ «ទ្រឹស្តីនៃទិដ្ឋភាពទិន្នន័យ៖ ការរចនាក្រាប»។ លោកគុណ ចិន្តា បានបង្រៀនពីរបៀបជ្រើសរើសប្រភេទក្រាប ដើម្បីបង្ហាញទិន្នន័យរបស់អ្នកឱ្យបានត្រឹមត្រូវ។ លោកបានមានប្រសាសន៍ថា «នៅពេលយើងជ្រើសរើសប្រភេទក្រាបត្រូវនឹងប្រភេទទិន្នន័យដែលយើងមាន ទស្សនិកជននឹងងាយយល់ ហើយគេនឹងងាយយល់ពីខ្លឺមសារដែលយើងព្យាយាមចែកចាយ ហើយធ្វើឱ្យក្រាបរបស់យើងមានភាពទាក់ទាញ»។

អ្នកចូលរូមកំពុងសួរសំណួរទាក់ទងនឹងអក្ខរកម្មទិន្នន័យ។
បន្ទាប់មក វគ្គស្តីពី «ការធ្វើទិន្នន័យជារូបភាព» ត្រូវបានបង្រៀនដោយលោក វង្ស ពិសិដ្ឋ។ គាត់បង្ហាញពីមូលដ្ឋានគ្រឹះនៃការបង្កើត និងរចនាក្រាបទិន្នន័យដោយប្រើប្រាស់កម្មវិធីរចនាទិន្នន័យ Datawrapper និង Google Data Studio។ បន្តិចម្តងៗ អ្នកចូលរួមយល់កើនតែច្បាស់អំពីដំណើរការនៃការរចនាក្រាបទិន្នន័យពីកម្មវិធីរចនាទិន្នន័យទាំងពីរ។ បន្ទាប់មកទៀត អ្នកចូលរួមត្រូវបានស្នើសុំឱ្យបង្កើតទិន្នន័យផ្ទាល់ខ្លួនរបស់ពួកគេ។ សម្រាប់អ្នកចូលរួមភាគច្រើន នេះគឺជាលើកទីមួយរបស់ពួកគាត់ដែលត្រូវរចនាក្រាបផ្ទាល់ខ្លួន ដែលធ្វើឱ្យលំហាត់នេះមានភាពលំបាក ទន្ទឹមនឹងនេះក៏ប្រកបទៅដោយភាពសប្បាយរីករាយផងដែរ។ នៅពេលរួចរាល់ ក្រាបទិន្នន័យរបស់ពួកគេមើលទៅស្អាត មានភាពទាក់ទាញ និងងាយស្រួលយល់។
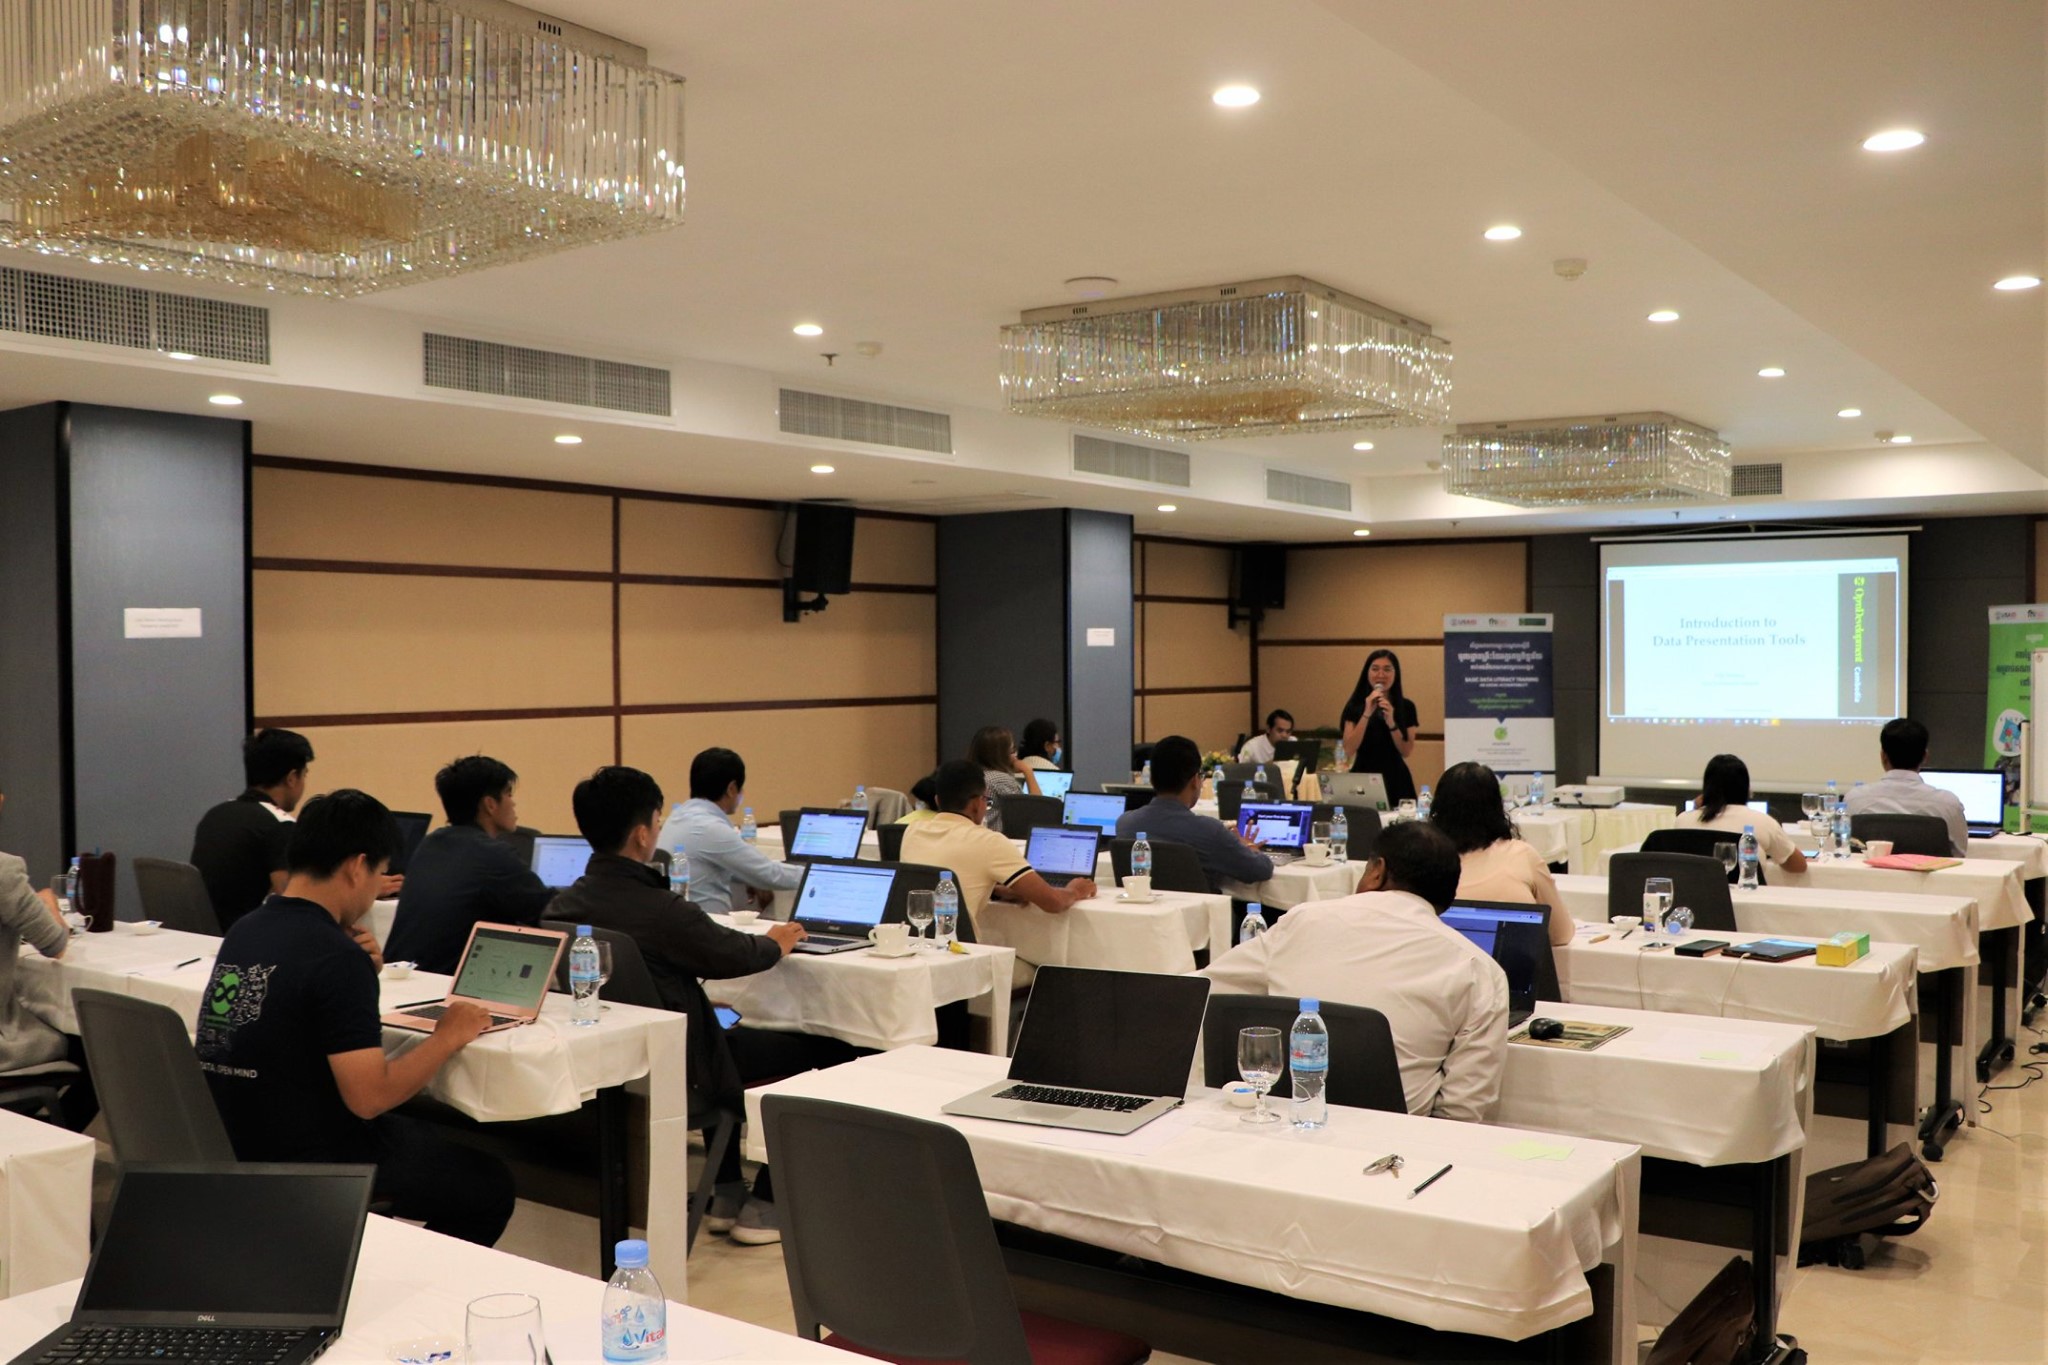
កញ្ញ ជី បូណ៌មីកំពុងធ្វើបទបង្ហាញស្តីពី រូបភាពទិន្នន័យ។
ថ្ងៃចុងក្រោយនៃសិក្ខាសាលាបណ្តុះបណ្តាលស្តីពី មូលដ្ឋានគ្រឹះនៃអក្ខរកម្មទិន្នន័យ ចាប់ផ្តើមដោយការសង្ខេបឡើងវិញនៅអ្វីដែលបានរៀនថ្ងៃទី១ និងទី២។ ថ្ងៃចុងក្រោយនេះ ផ្តោតសំខាន់ទៅលើការបង្ហាញទិន្នន័យ។ វគ្គសំខាន់ចំនួនពីរគឺ ផ្ទាំងទិន្នន័យ និងឧបករណ៍បង្ហាញទិន្នន័យ។ វគ្គផ្ទាំងទិន្នន័យ បង្រៀនឱ្យអ្នកចូលរួមបំប្លែងទិន្នន័យ ឬព័ត៌មានរបស់ពួកគេទៅជាទម្រង់ជារូបភាព ឬ ផ្ទាំងទិន្នន័យ។ លោក គុណ ចិន្តា ទទួលបន្ទុកវគ្គនេះ។ ក្នុងវគ្គនេះលោកបានពន្យល់អំពីមូលដ្ឋានគ្រឹះ អ្វីដែលគួរដាក់ និងមិនគួរដាក់ និងប្រភេទផ្ទាំងទិន្នន័យ ទាំង១០ ប្រភេទ។ បន្ទាប់ពីនោះ កញ្ញា ជី បូណ៌មី បានបង្រៀនពីកម្មវិធីបង្ហាញទិន្នន័យដូចជា Pitokchart និង Canva ។ កម្មវិធីទាំងនេះស្ថិតក្នុងកម្មវិធីបង្ហាញទិន្នន័យជាមូលដ្ឋានដែលអនុញ្ញាតឱ្យអ្នកប្រើបង្កើតផ្ទាំងទិន្នន័យផ្ទាល់ខ្លួនរបស់ពួកគេ។ កញ្ញា បានបន្ថែម “វាសាមញ្ញហើយមិនពិបាកប្រើទេ។ ពេលដែរប្រើ់ឧបករណ៍ទាំងនេះនឹងអនុញ្ញាតឱ្យអ្នកបង្កើតរូបភាពផ្ទាល់ខ្លួនរបស់យ៉ាងងាយស្រួលដែលមានប្រយោជន៍ក្នុងការចែកចាយព័ត៌មានដល់សាធារណៈជនជាទម្រង់រូបភាព” ។
នៅចុងបញ្ចប់ អ្នកចូលរួមទាំងអស់ទទួលបានវិញ្ញាបនបត្រ ដែលនេះជាផ្នែកមួយនៃកម្មវិធីបណ្តុះបណ្តាល និងអមដោយការថតរូបជាក្រុមជាកិច្ចបញ្ចប់។ សិក្ខាសាលាបណ្តុះបណ្តាលស្តីពី មូលដ្ឋានគ្រឹះនៃអក្ខរកម្មទិន្នន័យឆ្នាំ២០២០ ទាក់ទងនឹងគណនេយ្យភាពសង្គមបានបញ្ចប់ជាស្ថាពរ និងប្រកបដោយជោគជ័យ។
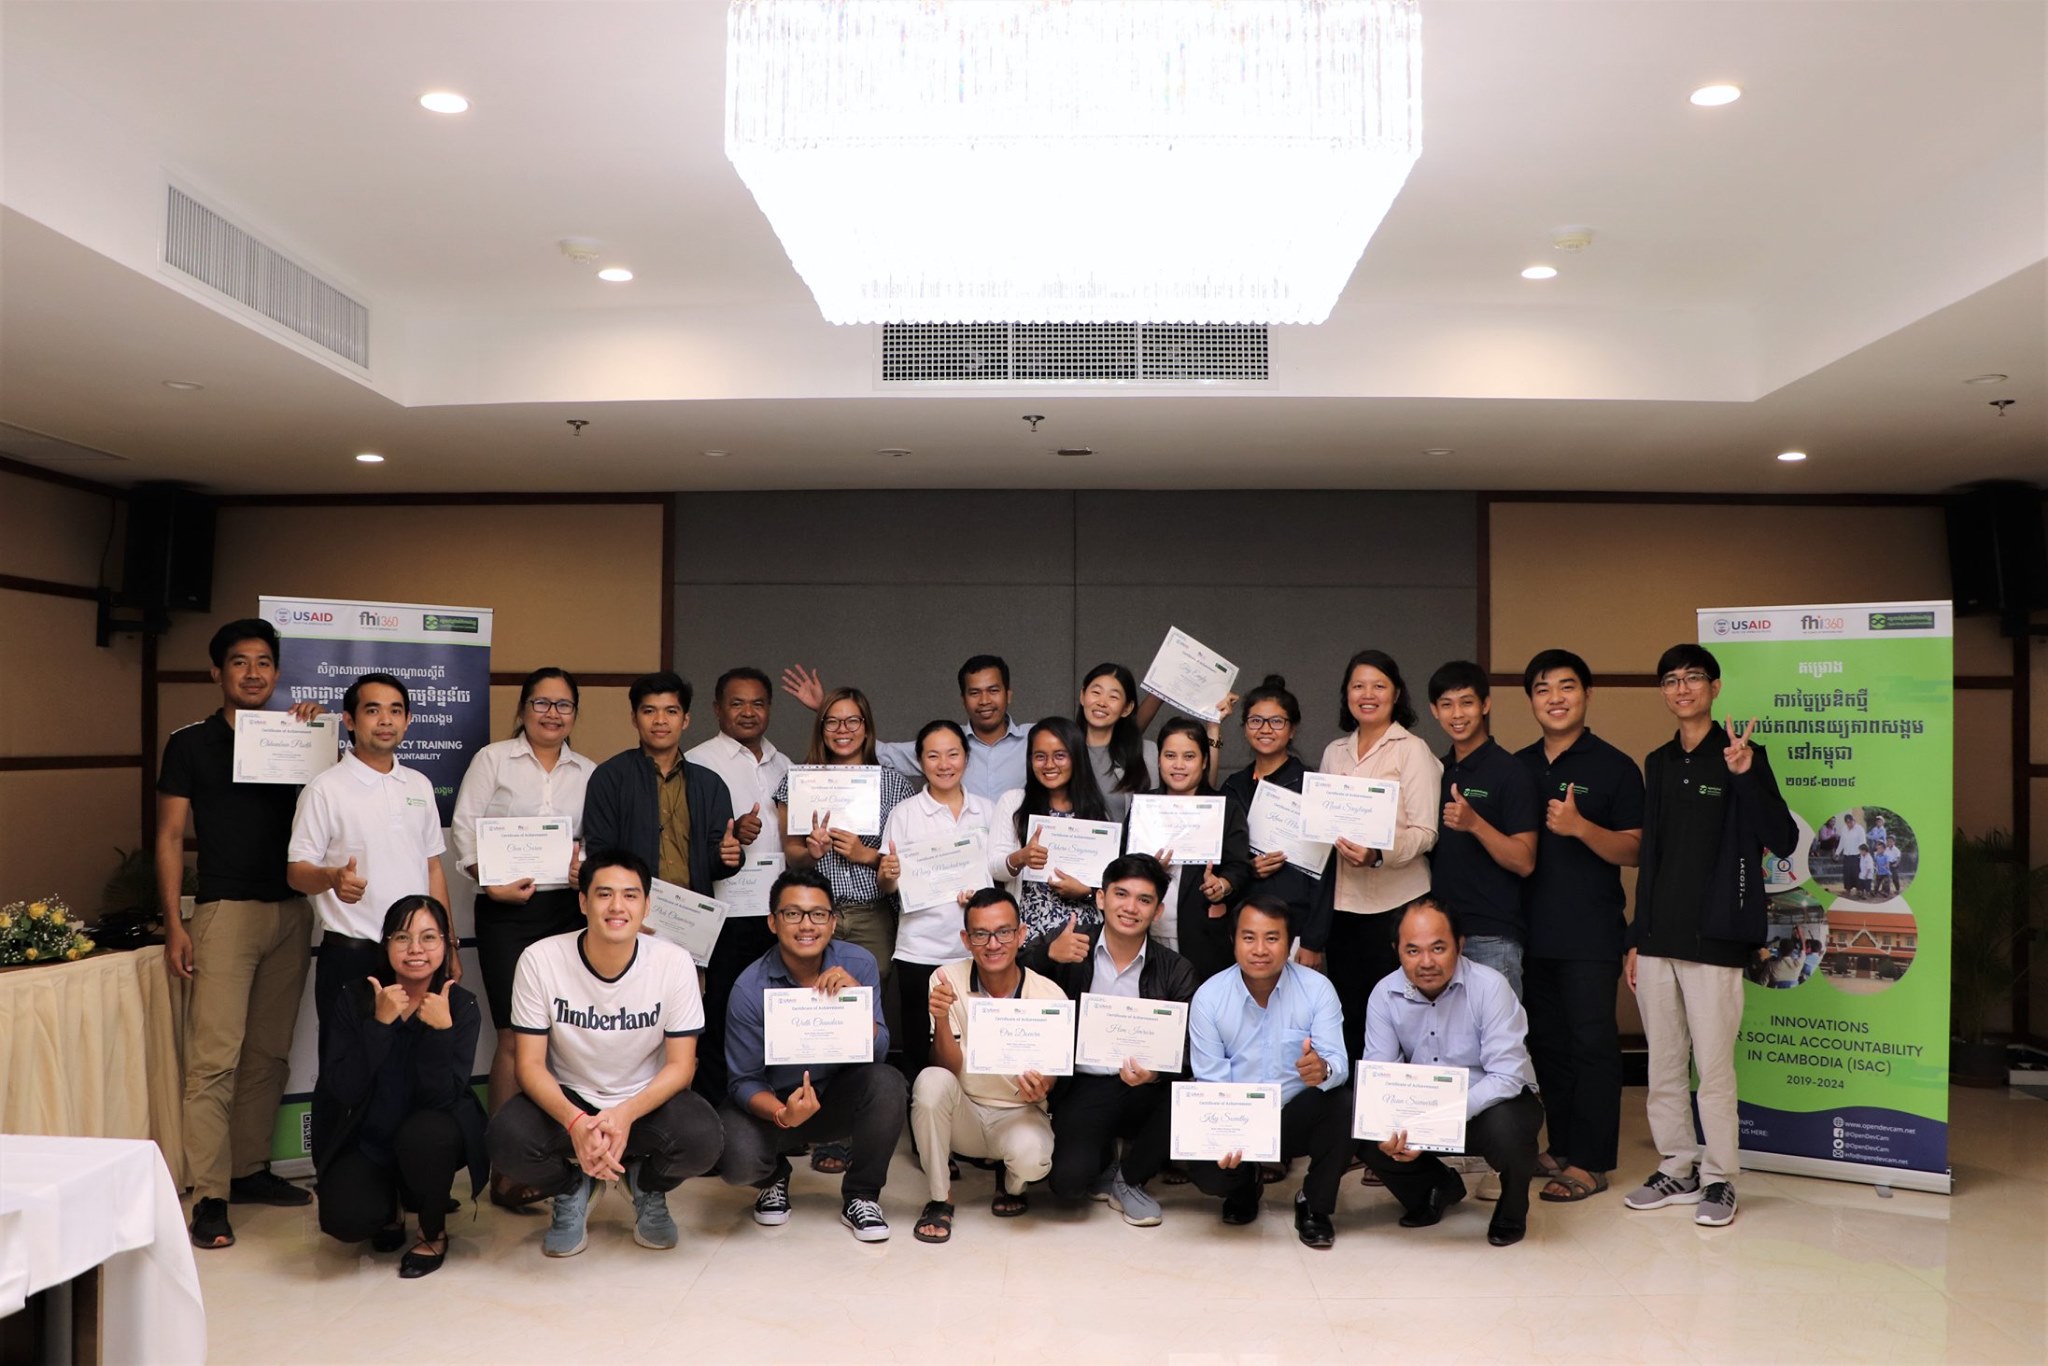
រូបថតជាក្រុមចុងក្រោយ មុនពេលបិទសិក្ខាសាលាបណ្តុះបណ្តាលស្តីពី មូលដ្ឋានគ្រឹះនៃអក្ខរកម្មទិន្នន័យឆ្នាំ២០២០។
សាស្ត្រាចារ្យច្បាប់ និងជាអ្នកពិគ្រោះយោបល់ឯករាជ្យមកពីខេត្តបាត់ដំបងបានបង្ហាញទស្សនៈរបស់ខ្លួនលើសិក្ខាសាលានេះថាមានប្រយោជន៍ និងសំខាន់ណាស់។ «វាមានប្រយោជន៍សំរាប់សាស្ត្រាចារ្យដូចជារូបខ្ញុំ។ ខ្ញុំអាចបង្កើតទិន្នន័យផ្ទាល់ខ្លួនរបស់ខ្ញុំ និងធ្វើជាឯកសារសិក្សាថ្មីសម្រាប់សិស្សរបស់ខ្ញុំ»។ គាត់ពិតជាពេញចិត្តនឹងវគ្គ «មូលដ្ឋាននៃការរៀចំទិន្នន័យ (PDF) និងការណែនាំអំពីកម្មវិធី Khmer OCR»។ ការទទួលបានជំនាញនេះនឹងជួយដោះស្រាយបញ្ហាប្រចាំថ្ងៃដែលគាត់ប្រឈម ដោយមិនចាំបាច់សុំជំនួយពីអ្នកដទៃ។ លោកក៏បានថ្លែងអំណរគុណចំពោះអូឌីស៊ីដែលបានរៀបចំ និងអនុញ្ញាតឱ្យគាត់ចូលរួមក្នុងឱកាសដ៏កម្រនេះលើការបណ្តុះបណ្តាលចំណេះដឹងអំពីទិន្នន័យ។
អ្នកចូលរួមម្នាក់ទៀតដែលជាអ្នកសារព័ត៌មានក៏បានបង្ហាញនូវចំណាប់អារម្មណ៍ស្រដៀងគ្នាស្តីពីអក្ខរកម្មទិន្នន័យឆ្នាំ ២០២០នេះ។ លោកមានប្រសាសន៍ថា ឱកាសដូចនេះគឺកម្រណាស់ហើយសង្ឃឹមថាមានការបណ្តុះបណ្តាលទាក់ទងនឹងទិន្នន័យបន្ថែមទៀតនៅក្នុងព្រះរាជាណាចក្រ ដើម្បីជួយលើកកម្ពស់ចំណេះដឹង និងជំនាញរបស់ពលរដ្ឋលើទិន្នន័យ។ វគ្គសំណព្វរបស់គាត់គឺ «ការធ្វើទិន្នន័យជារូបភាព»។ គាត់បាននិយាយថា «កម្មវិធី និងជំនាញដែលខ្ញុំបានរៀនថ្ងៃនេះនឹងជួយខ្ញុំងាយស្រួលបង្ហាញទិន្នន័យអោយទស្សនិកជនបាន»។ លោកបានបន្ថែមថា «បន្ទាប់ពីវគ្គបណ្តុះបណ្តាលនេះខ្ញុំបានដឹងថាការរចនាក្រាបមិនមានភាពស្មុគស្មាញទាល់តែសោះ ប្រសិនបើយើងជ្រើសរើសឧបករណ៍ដែលត្រឹមត្រូវ។ ការដែលអាចបង្ហាញតួលេខនៅក្នុងទម្រង់ជារូបភាព និងក្រាប គឺមានសារៈសំខាន់ណាស់សម្រាប់អ្នកសារព័ត៌មាន ហើយនៅពេលដែលខ្ញុំអាចរចនាវាដោយខ្លួនឯង វាជួយសន្សំសំចៃពេលវេលារបស់ខ្ញុំបានច្រើនណាស់»។

