Data literacy training for public health
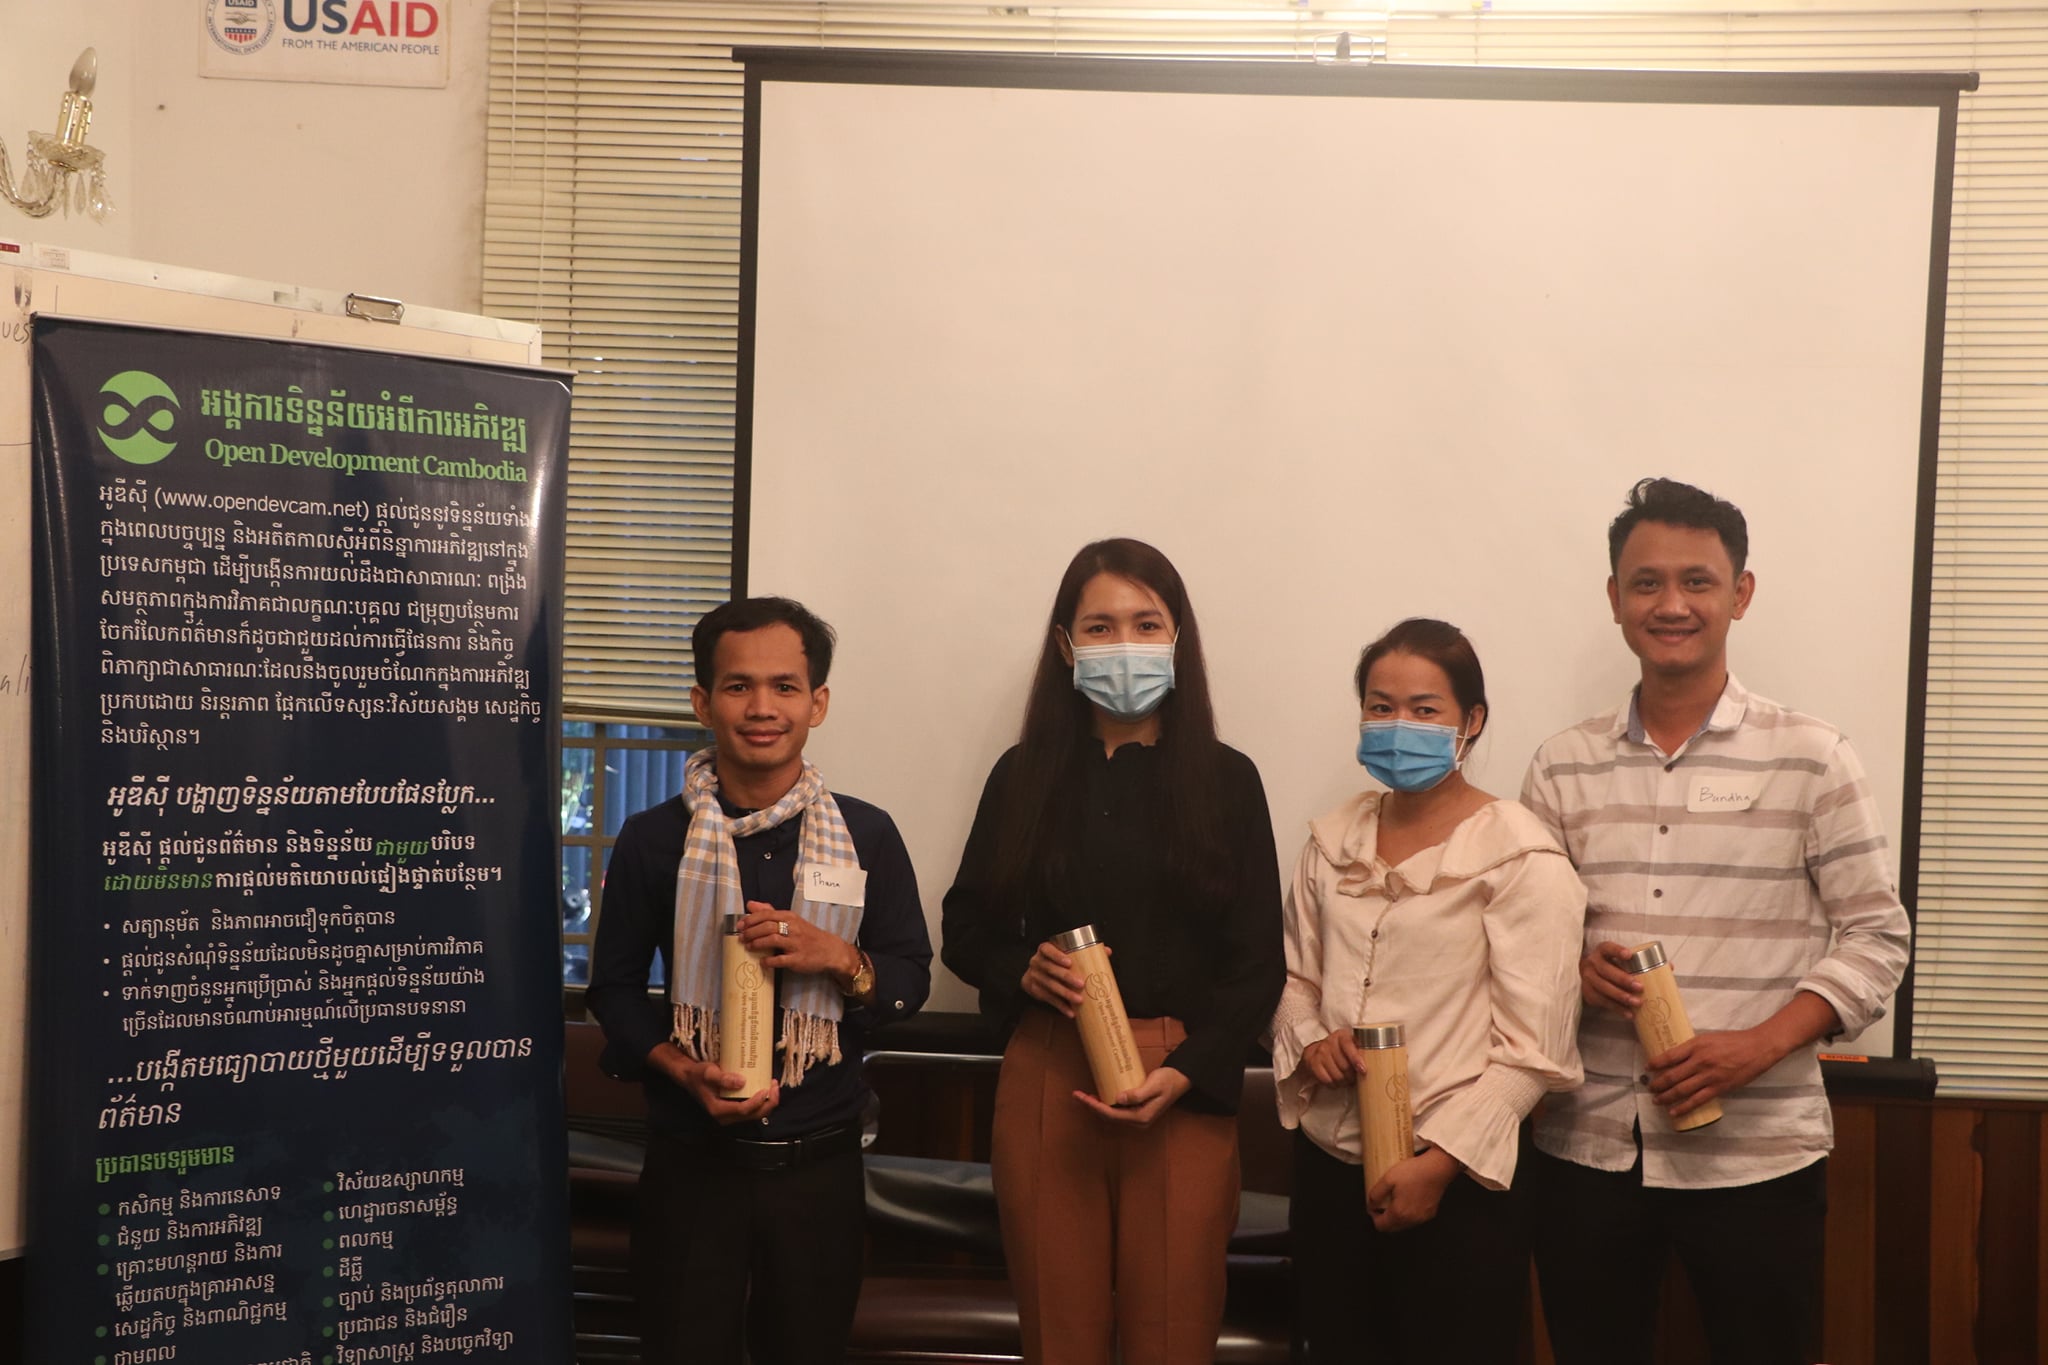
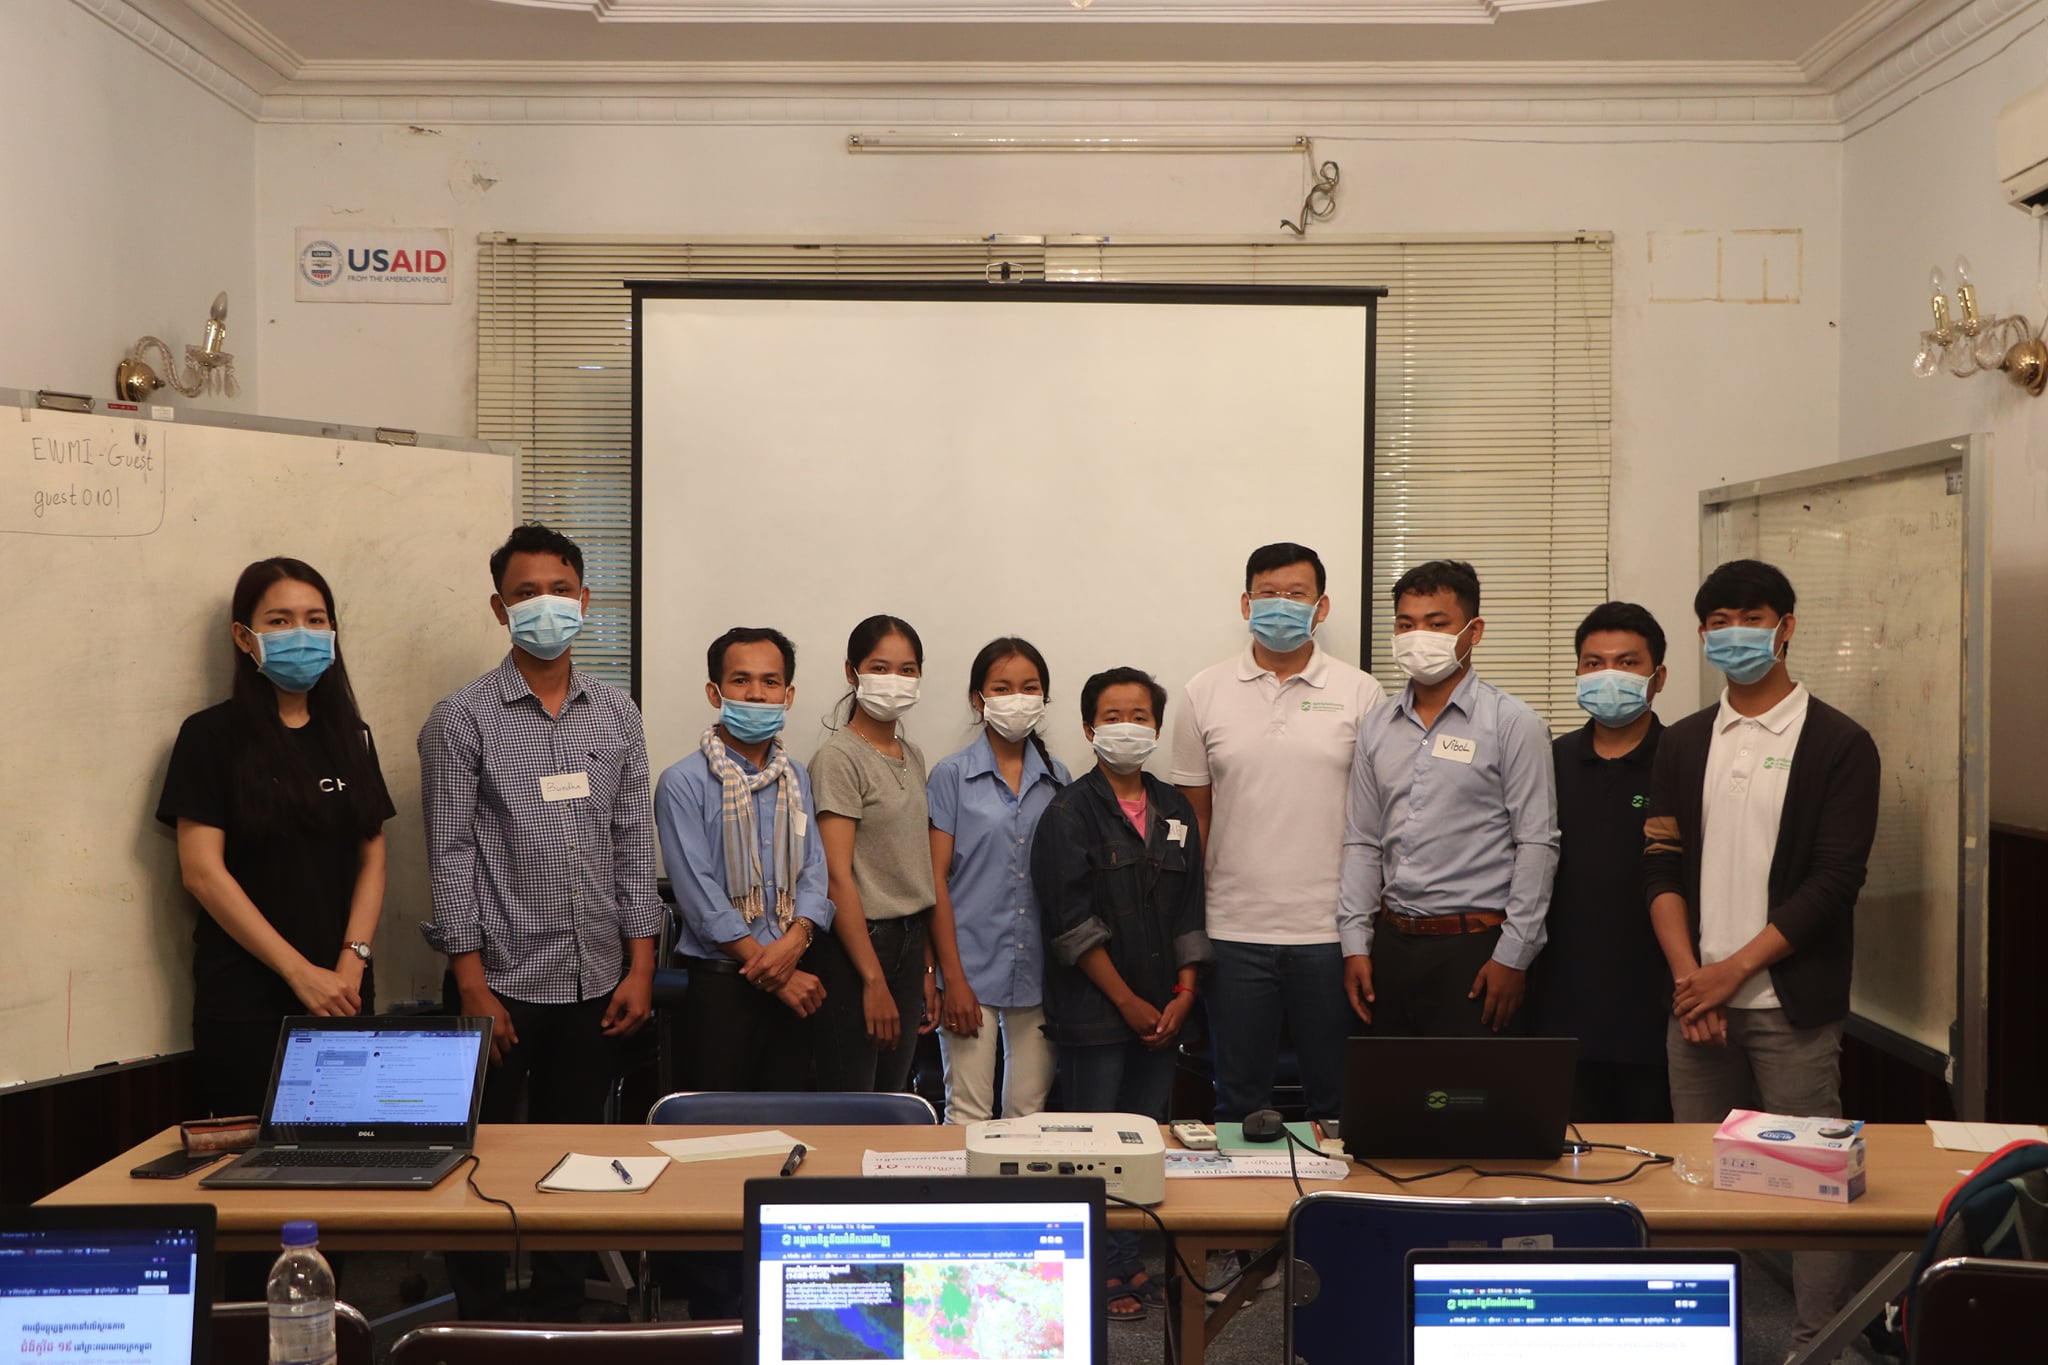
On 15-16 February 2021, Open Development Cambodia (ODC) successfully conducted a training workshop on “Data Literacy for Public Health”. The training was hosted at ODC’s office in Phnom Penh and gathered 11 participants from various backgrounds including citizen journalists, development project officers, research officers and university students, five of whom were women. This two-day training was made possible thanks to the support from the U.S. State of Department through the Institute for War and Peace Reporting, which was channeled through the project “A COVID-19 digital information hub to mobilize Cambodia”.
The overarching goal of this Data Literacy for Public Health Training Program was to stimulate a data culture in Cambodia while promoting evidence-based analysis and data-driven strategies to address public health issues. Bearing this goal in mind, the training was designed to equip participants with the ability to understand data and utilize it proficiently in their day-to-day work. The workshop focused on skills to find, clean and visualize data, especially regarding COVID-19 in Cambodia. On top of that, the training also aimed to enable participants to integrate data into stories that could reach a wider public outreach.
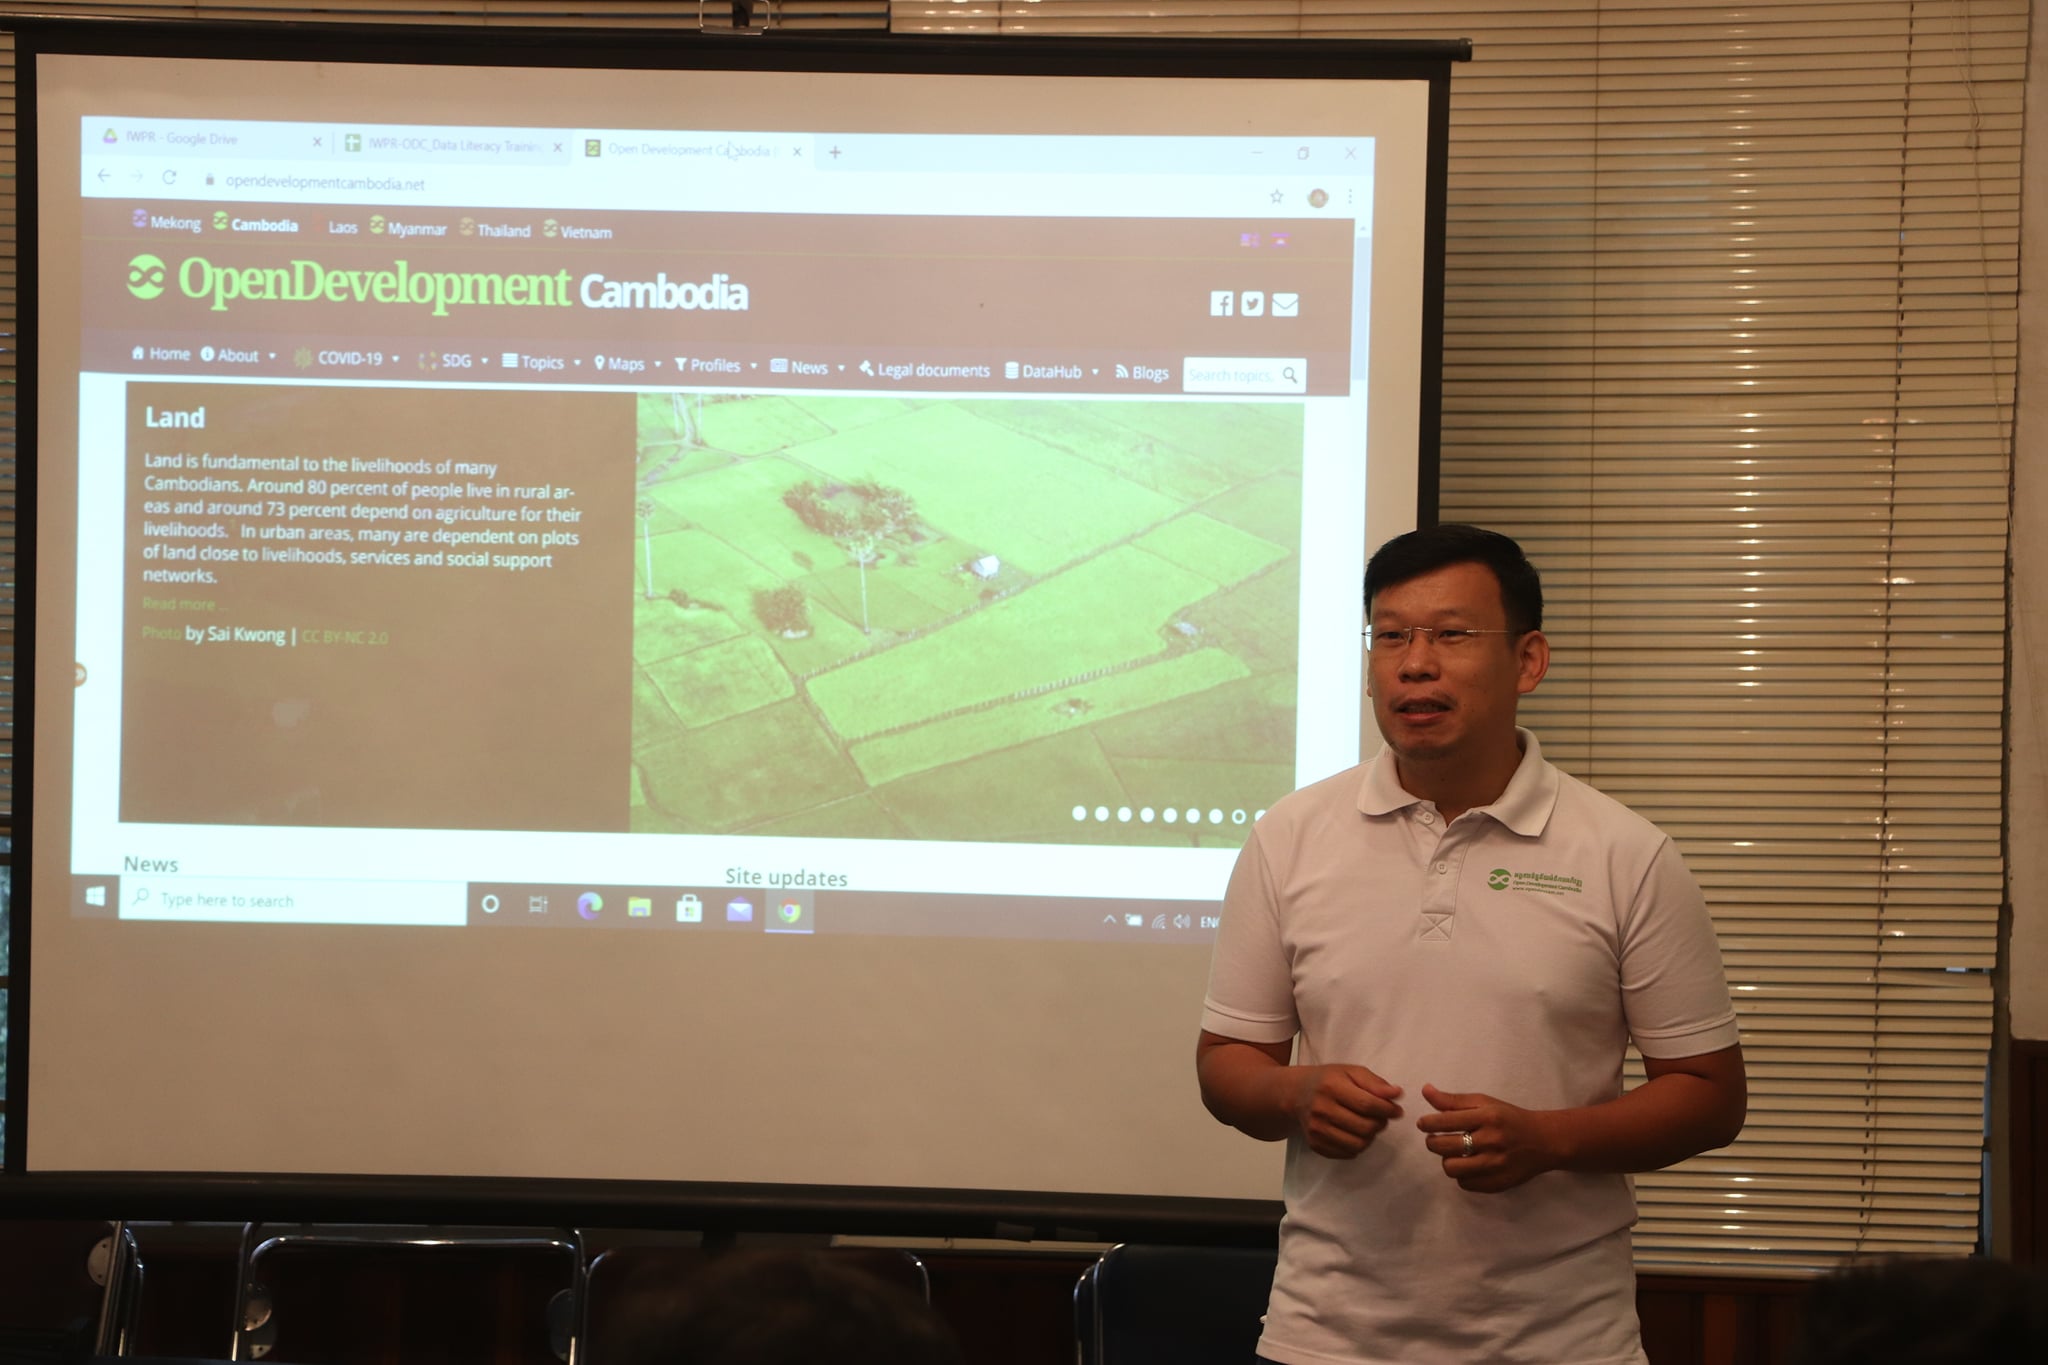
The training kicked off with the opening remark from Mr. Thy Try, ODC’s Executive Director. In his remark, Mr. Try portrayed the crucial role of data and how it can be used to disseminate information to the public. In that regard, he also highlighted the potential of using data in public health, particularly in the current context of the global COVID-19 pandemic. Mr. Try wished that by gaining skills in finding, cleaning and visualizing data, participants will be able to produce real data-driven writing in a way that is more reliable and appealing.
The remarks from the Executive Director were followed by the first session, delivered by Mr. Heang Kosal, an Economics editor-researcher of ODC. In this warm-up session, Mr. Kosal presented basic concepts, namely data types, the definition of open data and its importance, and the transparency cycle built upon open data. He then continued to link this introduction to its real-life applications by presenting several examples of appealing news articles containing data visualization. The purpose was to instill participants’ ability to differentiate what is reader-friendly news and what is not as well as to understand the importance of data-driven news.
Mr. Ban Chanphalla, social editor-researcher of ODC, presented multiple techniques used to find data online on the Google Advanced Search tool. Besides learning tips when looking for data, participants also learned about new data sources relevant to the topic. The next session was on Common Data Formats and run by Mr. Loch Kalyan, Data Research and GIS Specialist of ODC. Mr. Kalyan gave a comprehensive explanation of data formats and their types and introduced some computer tools for extracting data and information from PDF files into machine-readable data formats.
Once participants had been equipped with a basic conceptual understanding of data, the Senior Data Research and GIS Officer of ODC, Mr. Vong Pisith, delivered a more technical session on data cleaning skills. Mr. Pisith emphasized the vital importance of correctly understanding data standardization as a prerequisite to clean data properly and further data analysis.
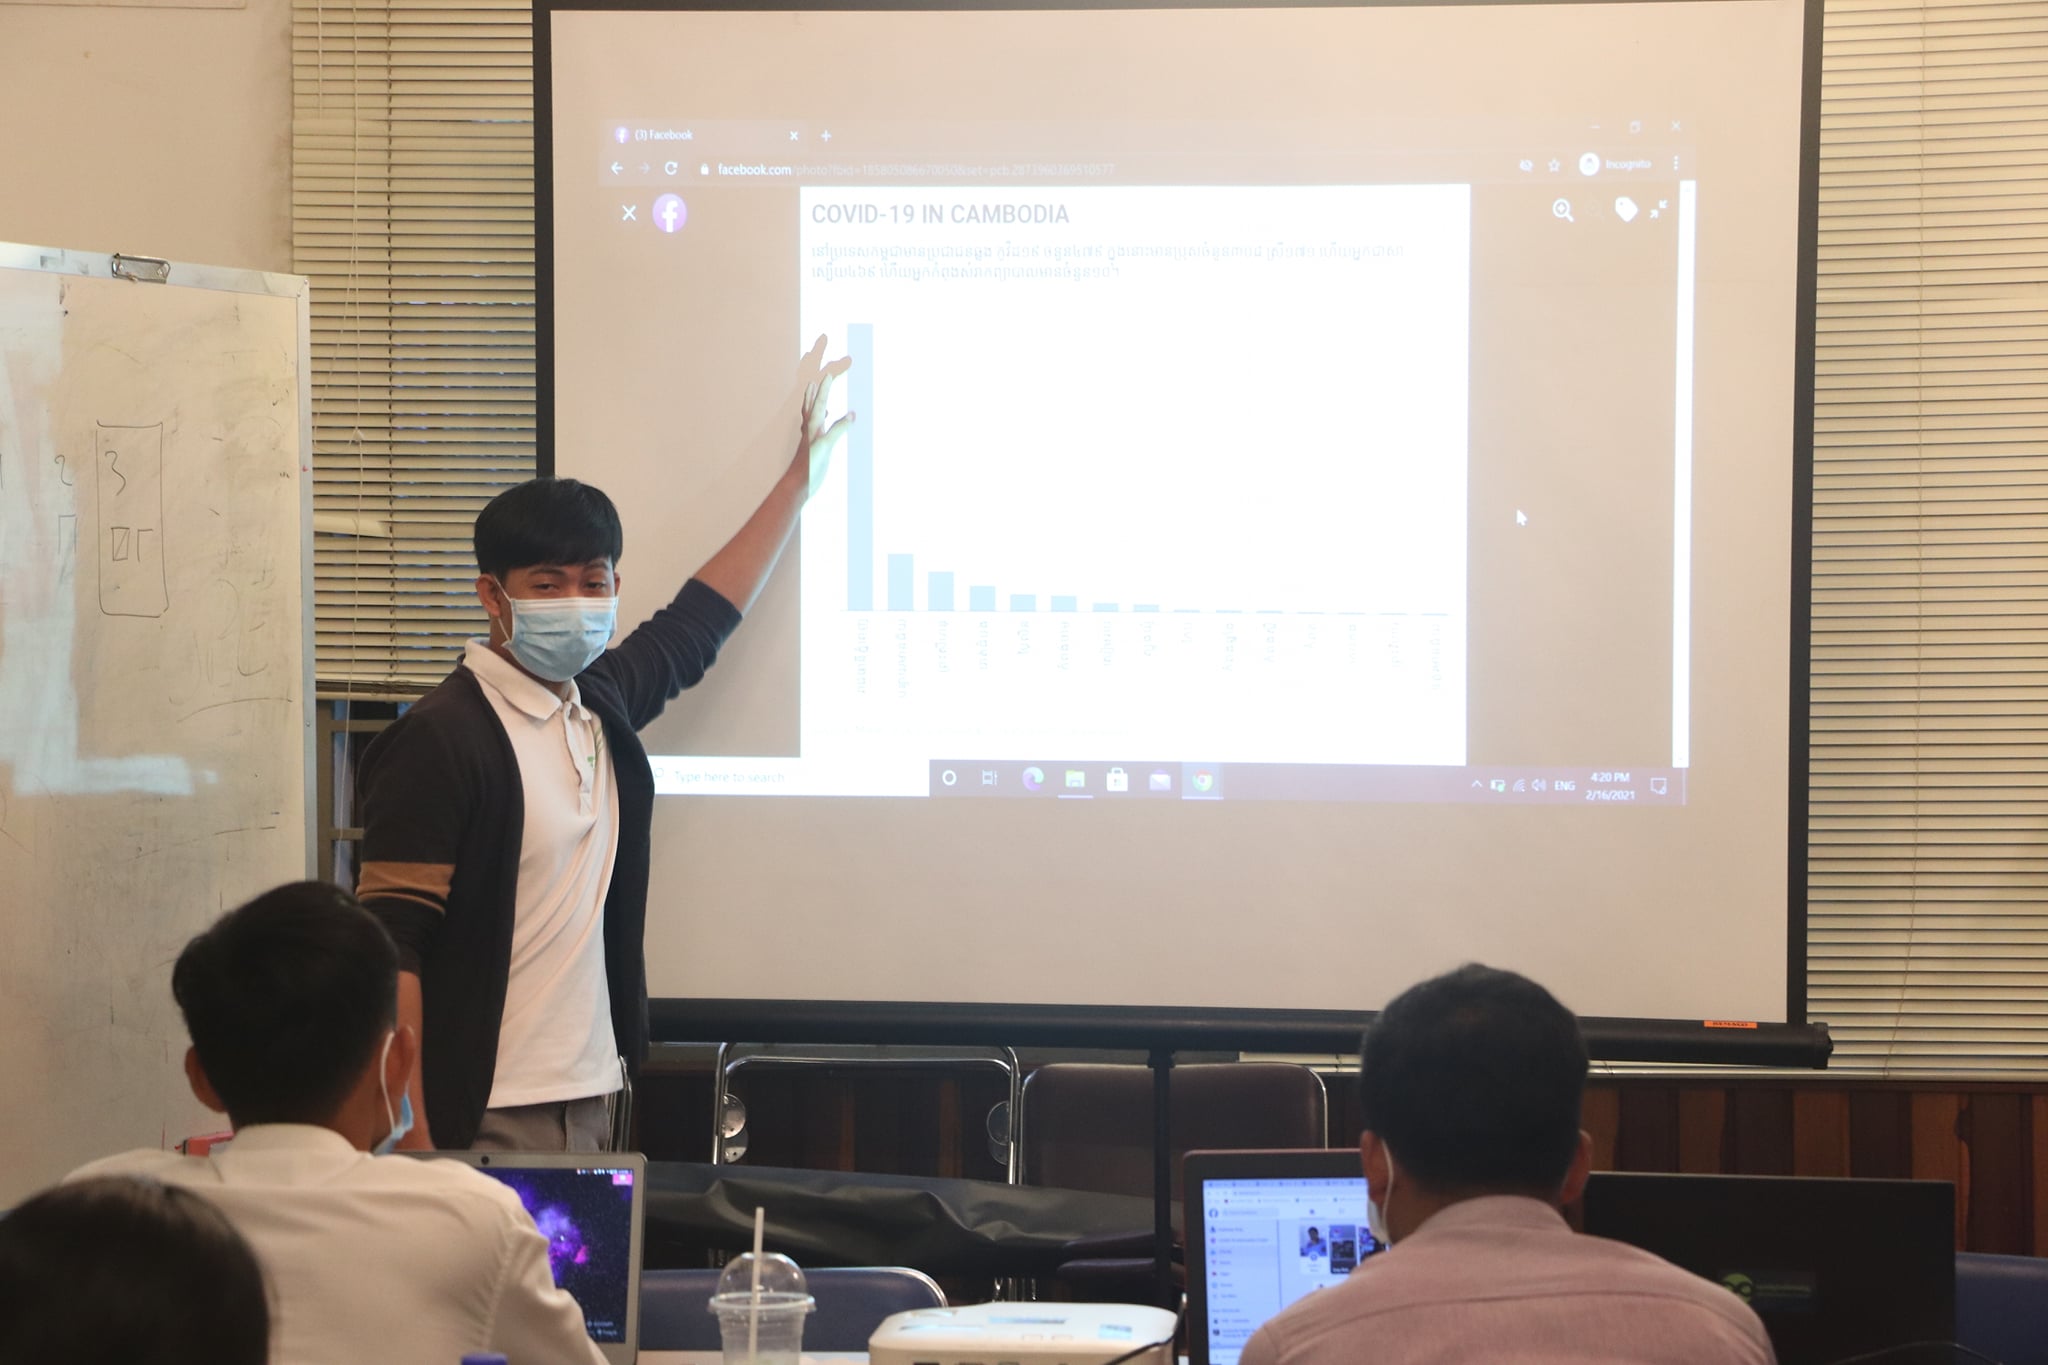
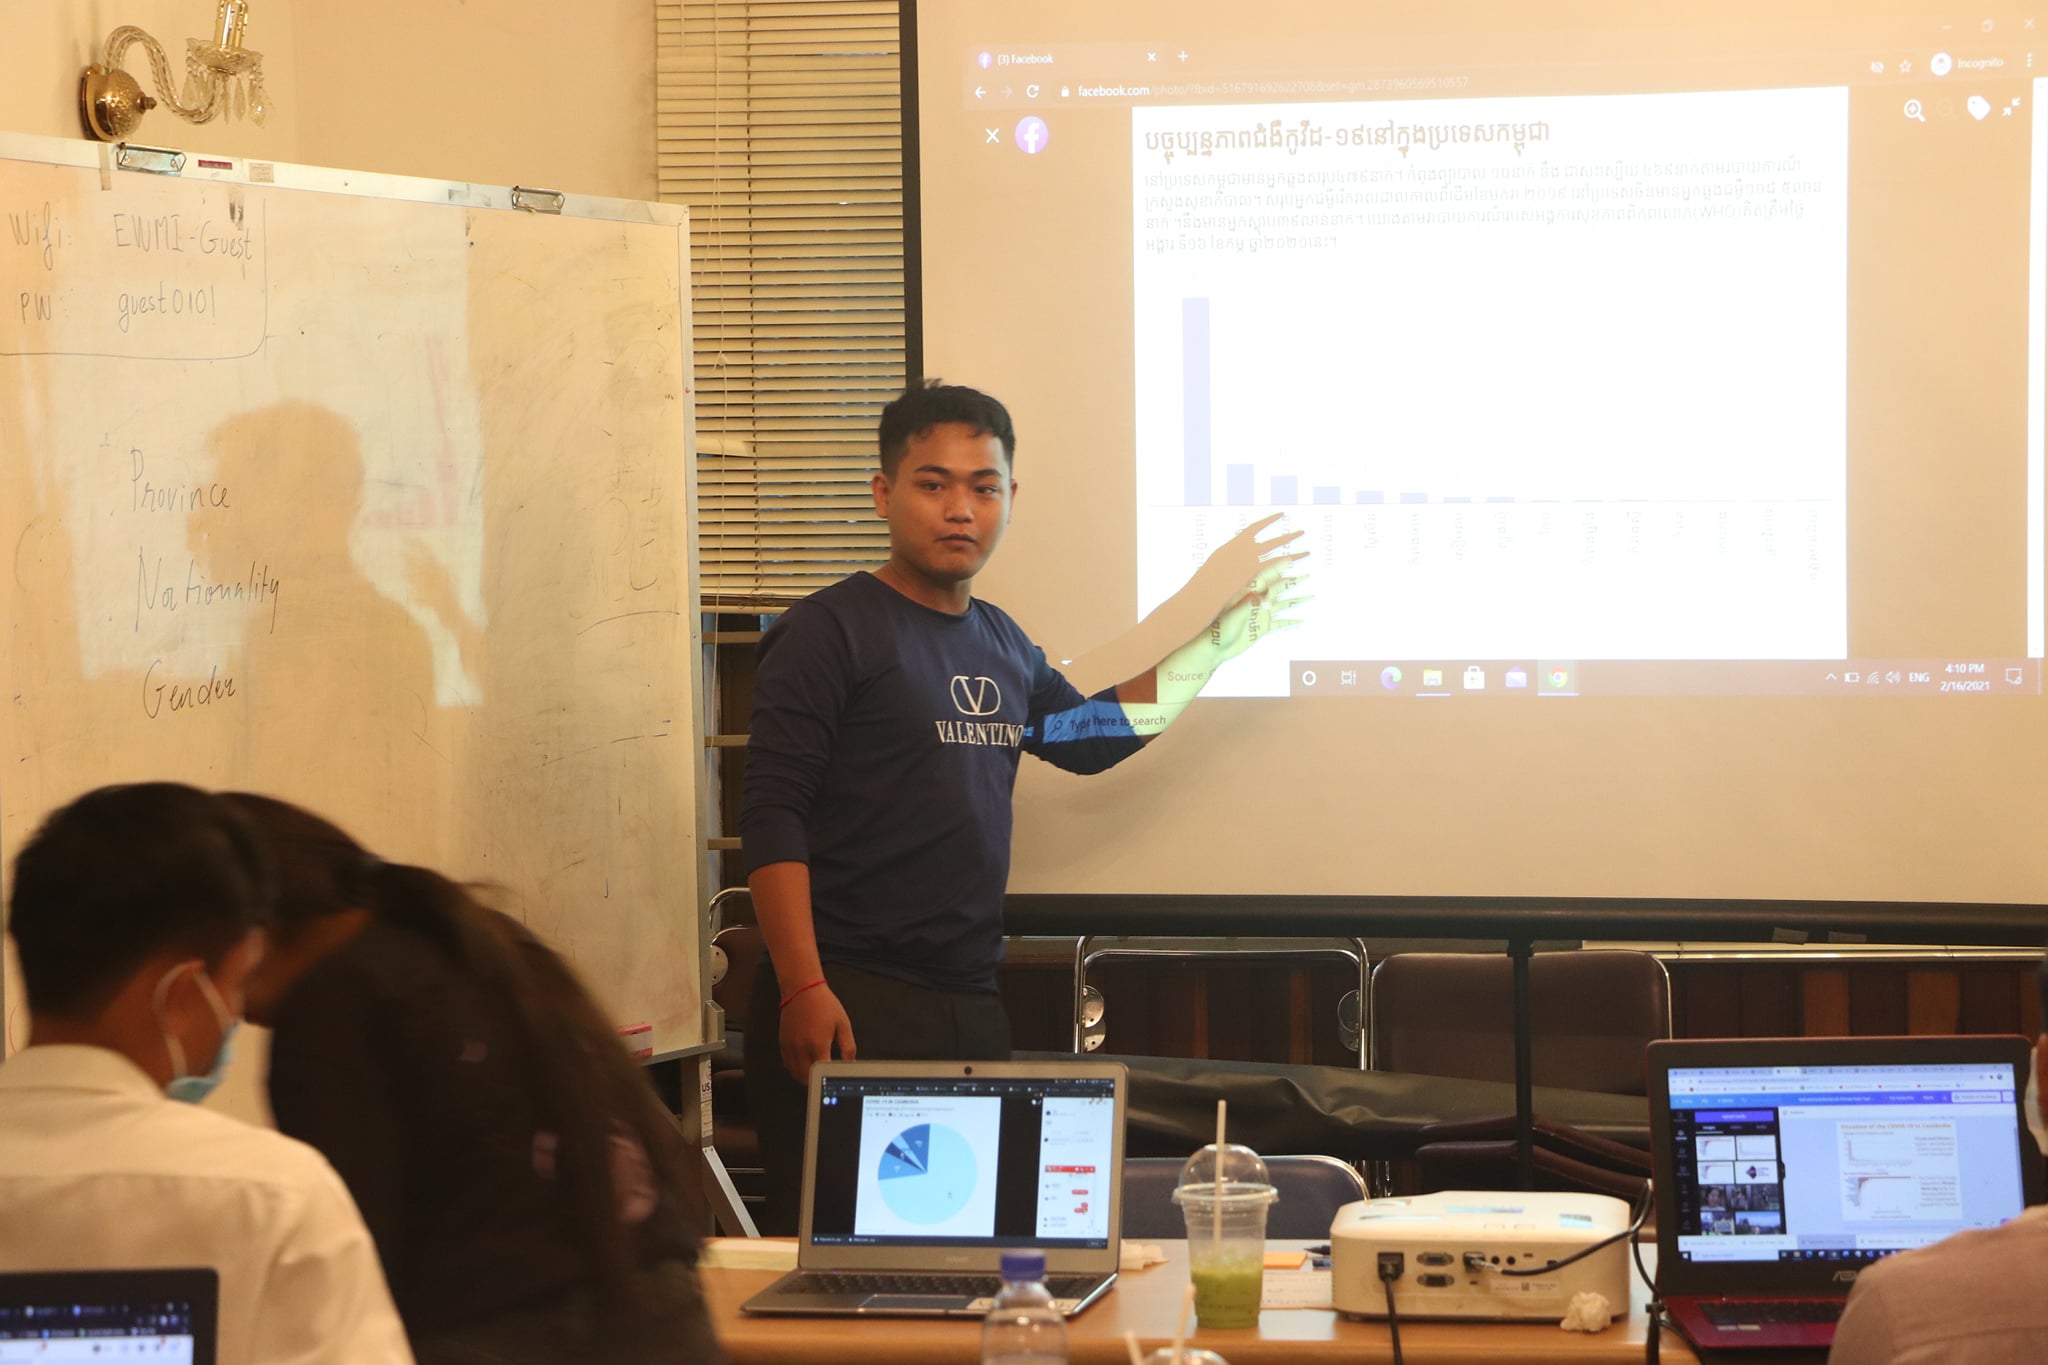
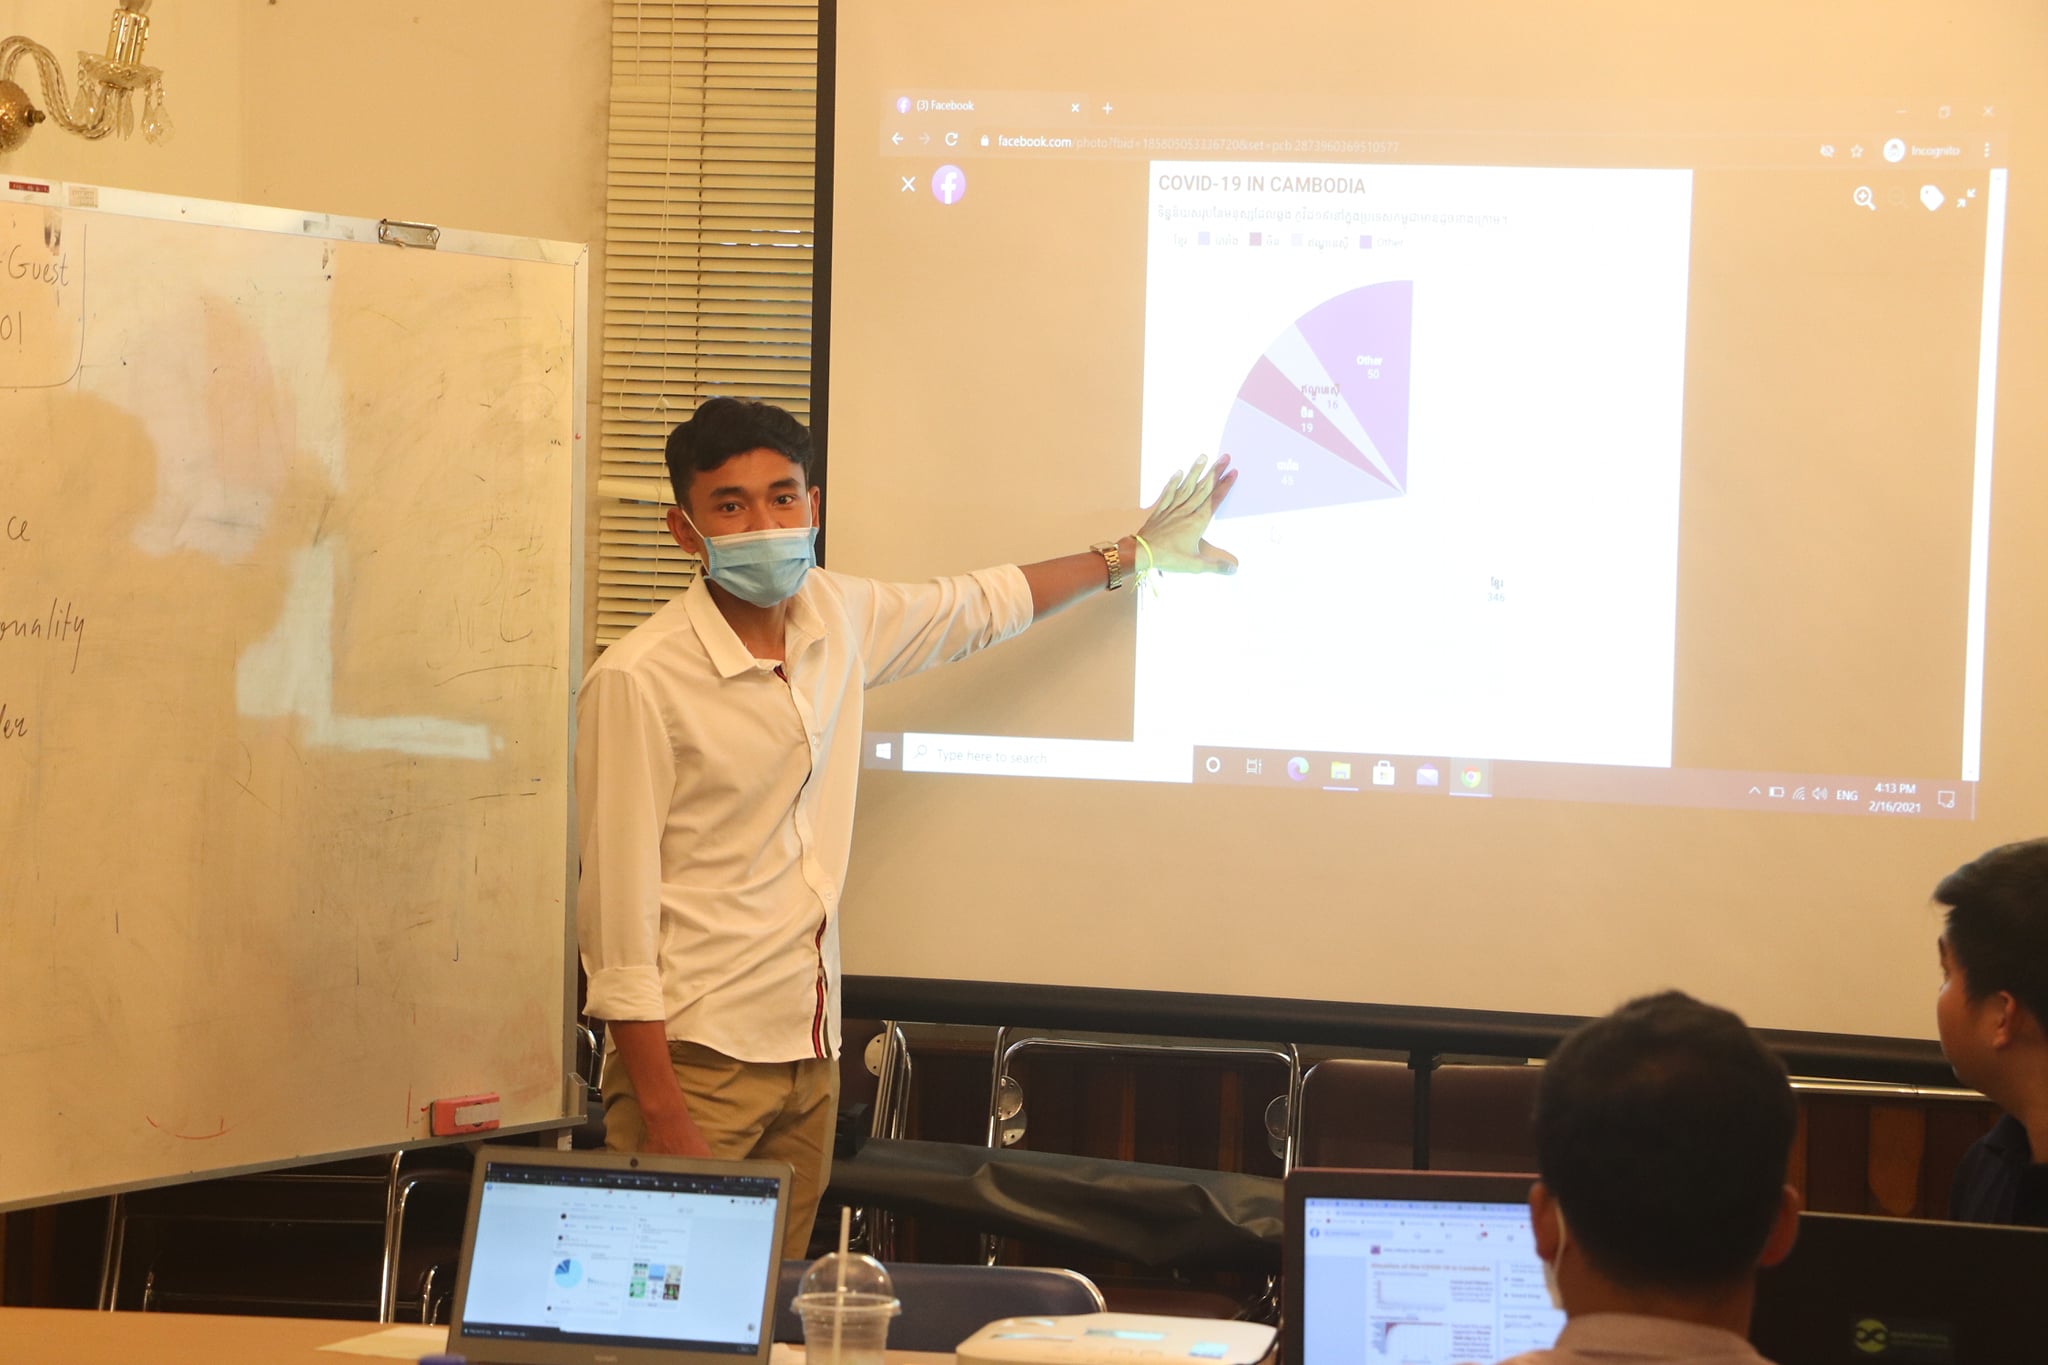
The second day began with Mr. Pisith’s introduction to data visualization, focusing on its power to channel complex stories to the audience. He mentioned the importance of choosing the right type of chart and reviewed the different steps to create one using Datawrapper, an online data visualization tool. This session included a hands-on exercise, which provided participants with a chance to apply the theory to a practical exercise related to COVID-19 in Cambodia.
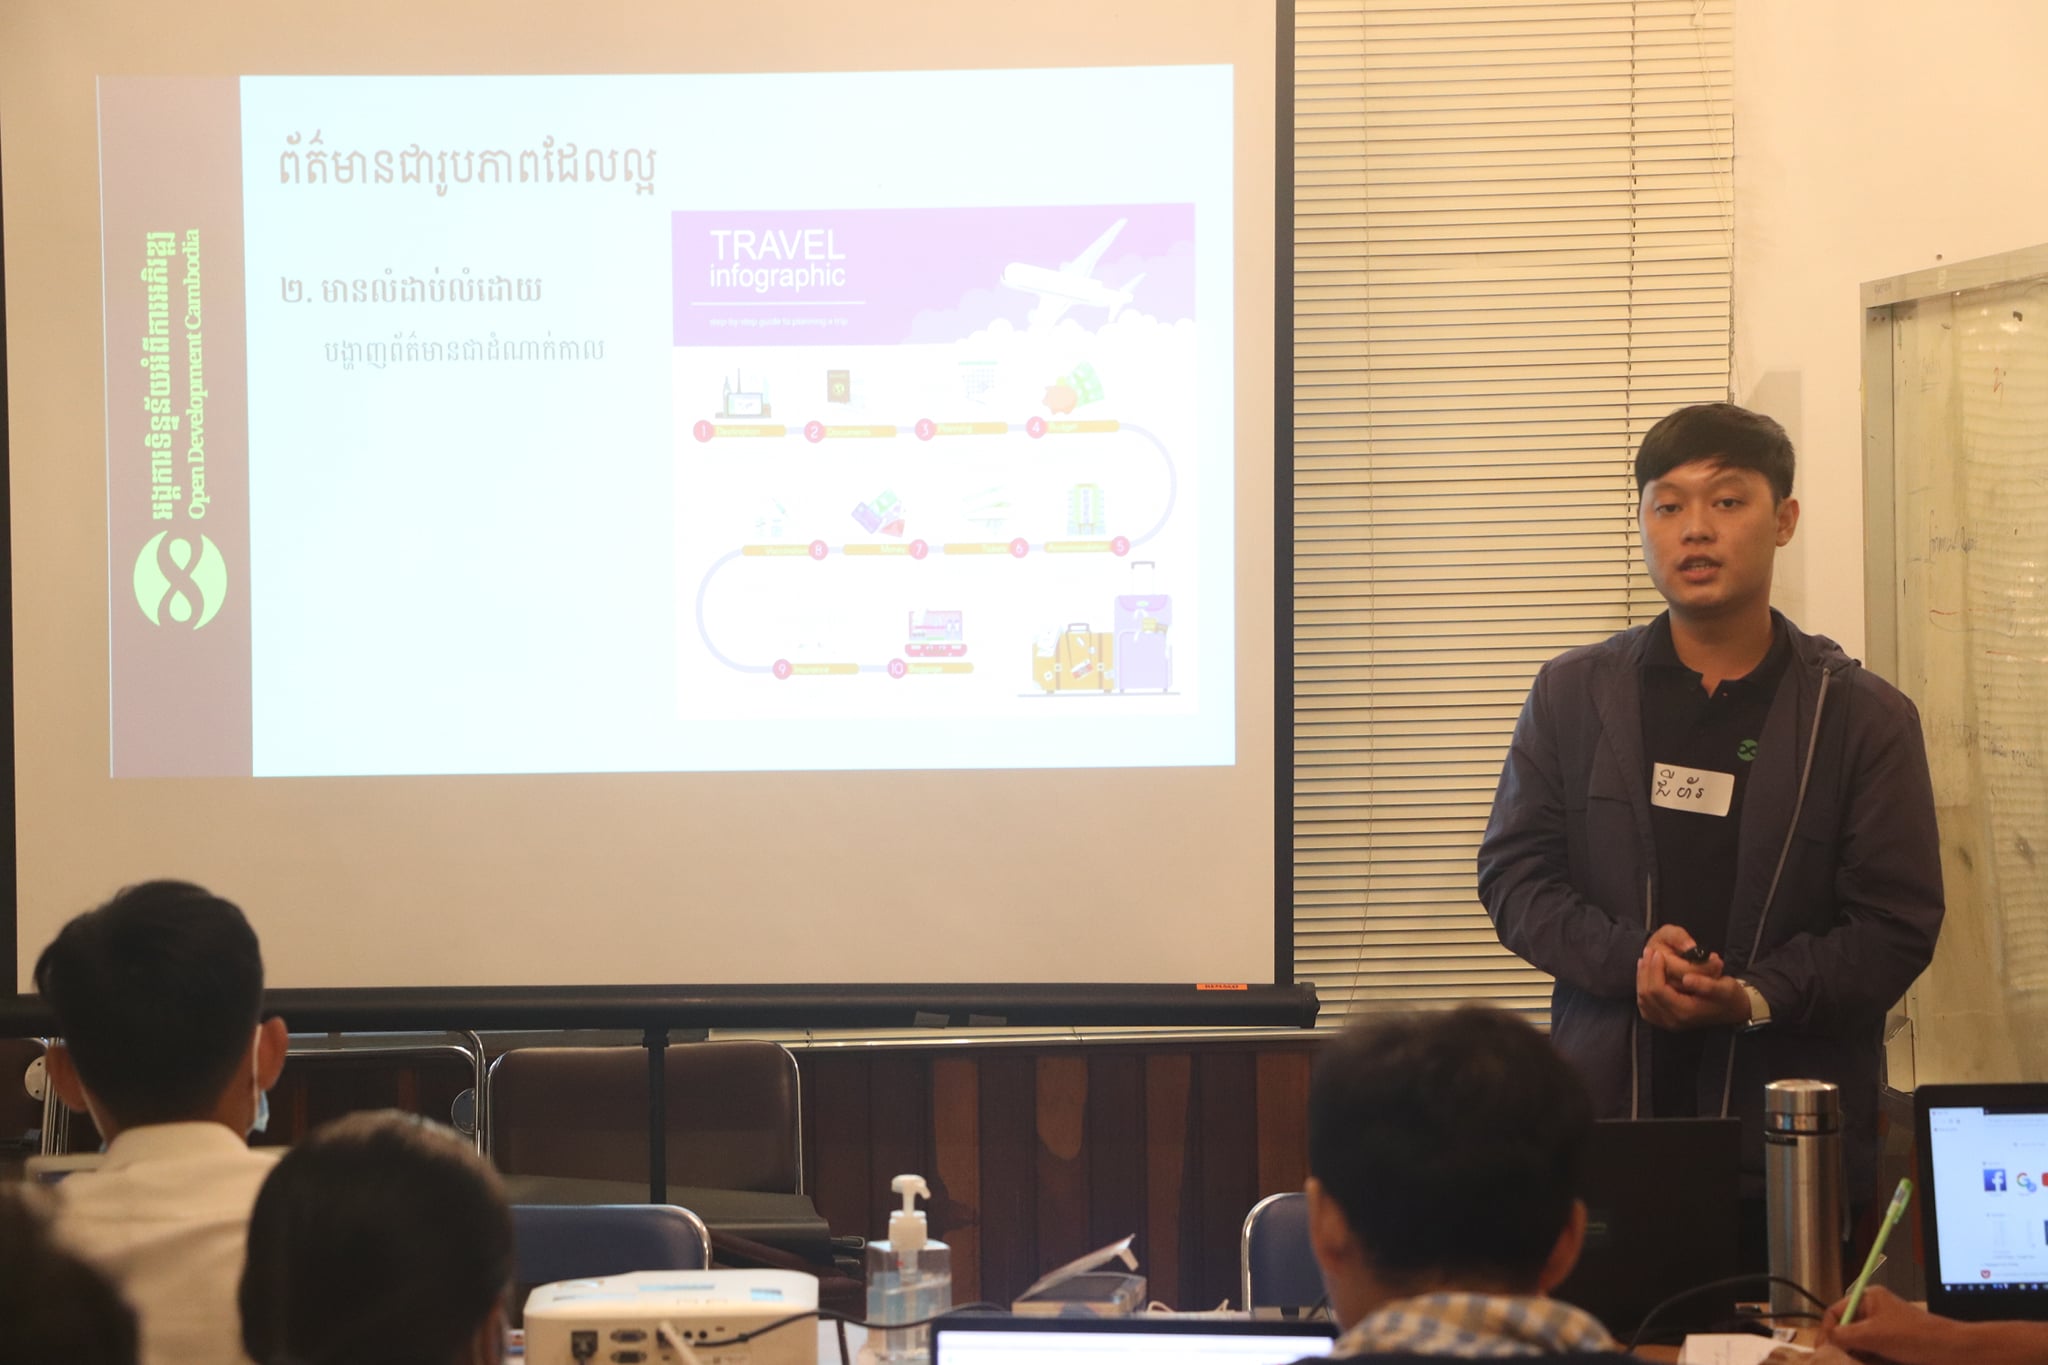
Mr. Ngov Chihor, Communications Officer of ODC, presented infographics as an alternative to visualize data. For that, he introduced an online tool called Canva and provided advice on producing professional infographics that convey clear and insightful messages. After learning how the tool worked, participants explored the tools and created their own infographics.
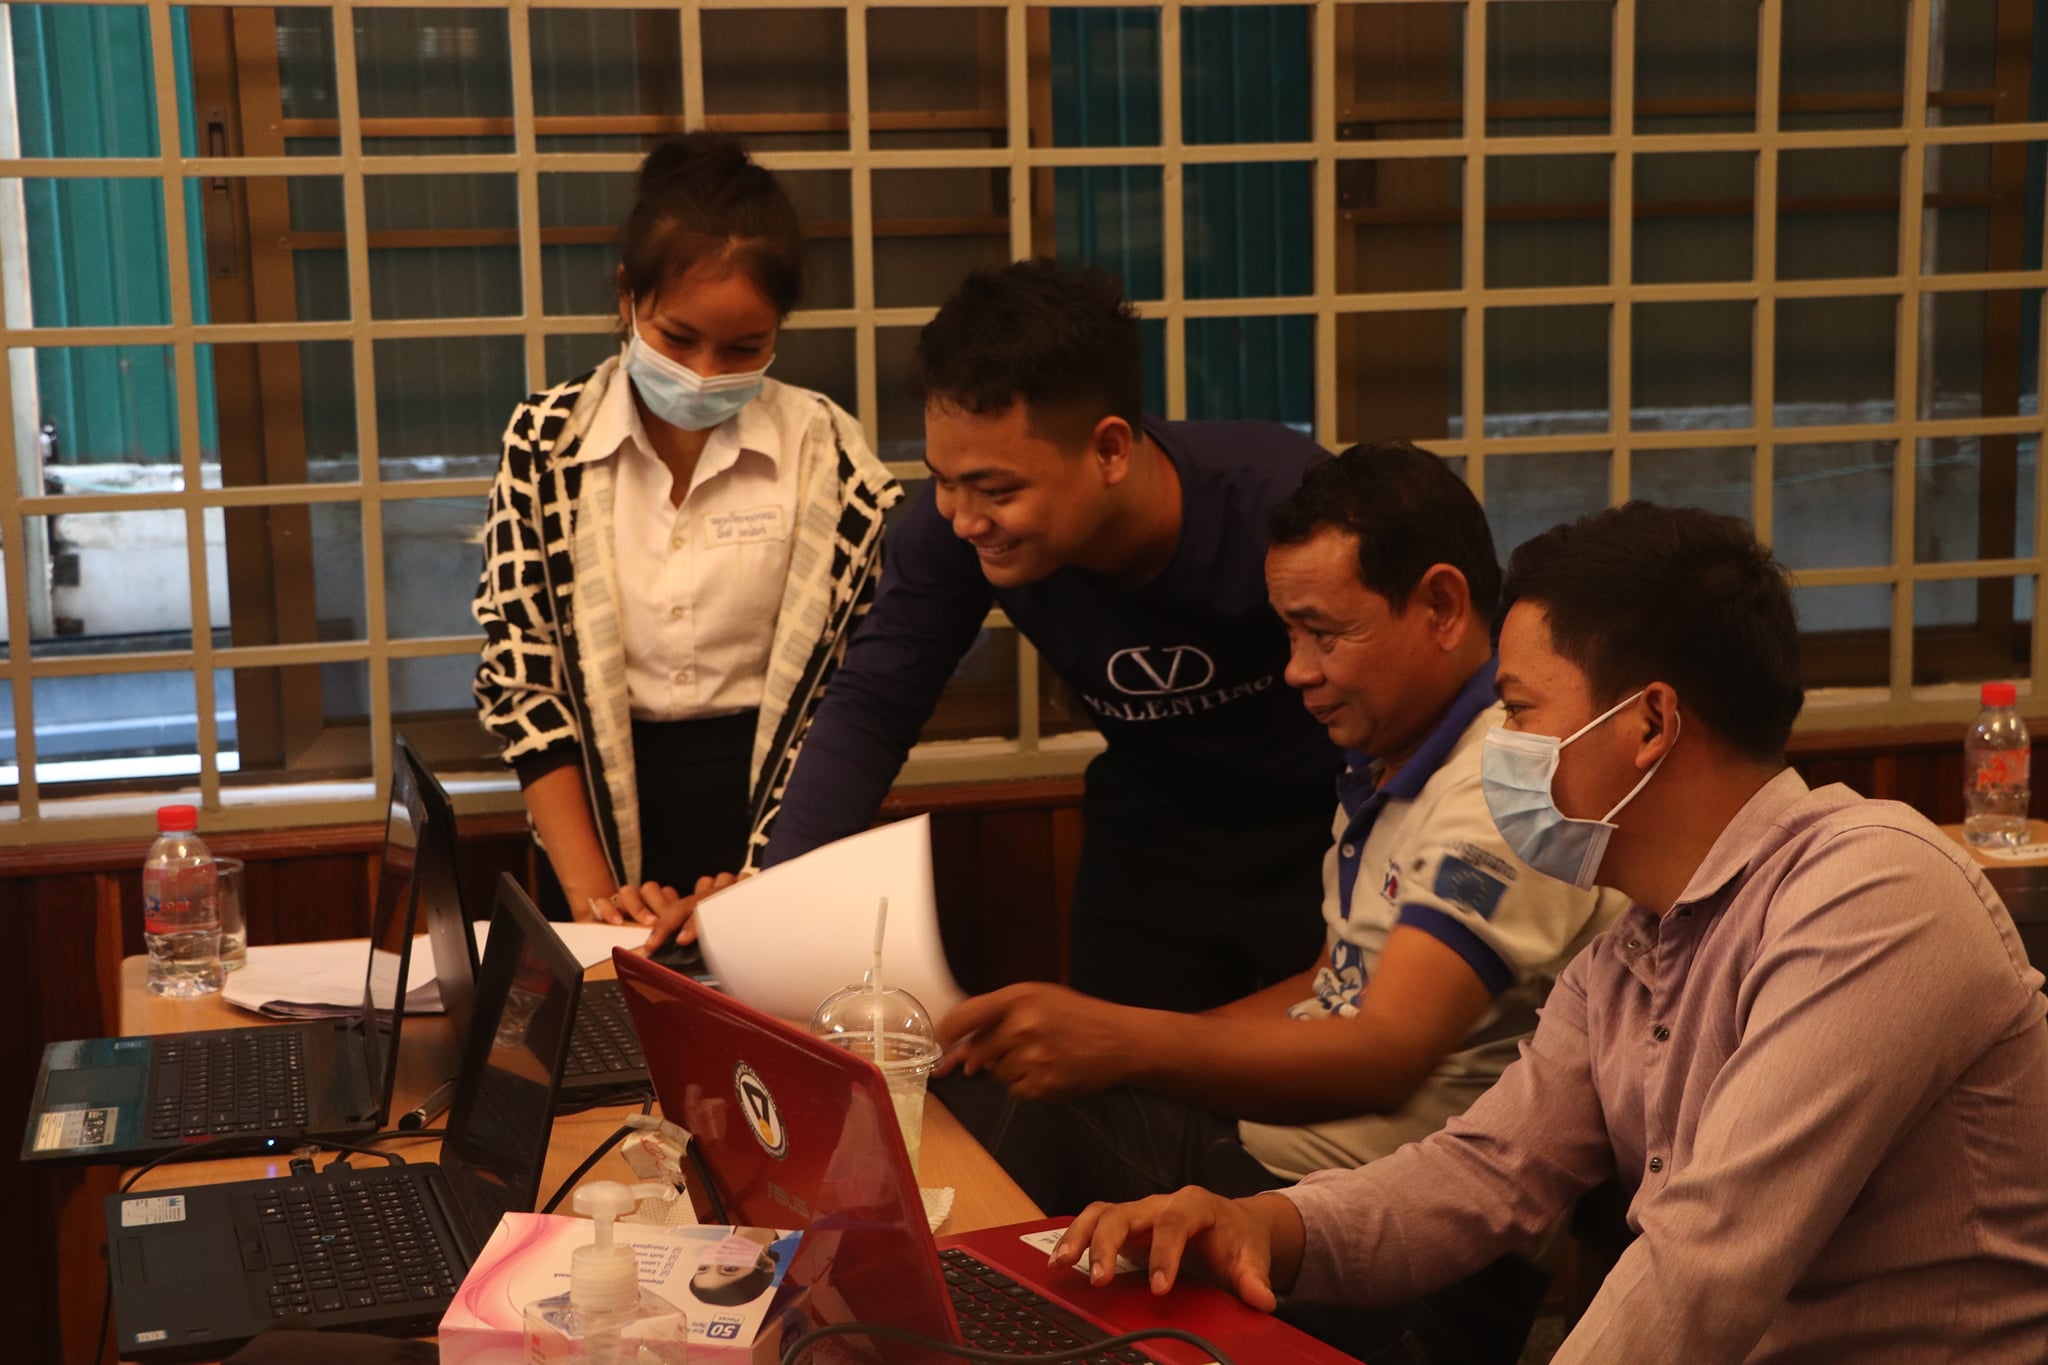
The highlight of the training was the group activity, in which participants left their comfort zone and applied the skills and knowledge acquired throughout the workshop. Besides, this was a perfect chance to interact with other participants and exchange their insights on public health data. During the activity, the ODC team provided guidance and solved questions of the different teams as they developed a COVID-19 data story with charts and infographics. It was exciting to witness the hard work participants put in and the ways they applied the skills gained to use data. The groups engaged in interesting discussions and shared different perspectives.
The overall data understanding and technical skills of participants substantially improved as a result of the training. Based on the pre-test and post-test assessment, as well as on the observation during the sessions, participants had more knowledge on using data and realized the potential impact of storytelling. They learned about finding reliable data more effectively as well as preparing and visualizing it. Importantly, they gained insights on integrating numbers and figures into their stories. Participants largely suggested ODC provide similar kinds of training to their peers who are working in the same areas and expertise. The ODC team was delighted to count on such an active group of participants and is looking forward to seeing their data-driven stories on COVID-19 soon.

