Third training: Data literacy for public health
On 27, 28, and 29 of April 2021, Open Development Cambodia (ODC) has successfully conducted a three-day training under the theme “Data Literacy for Public Health”. Due to the pandemic outbreak, the three-day training was hosted virtually on Zoom video conferencing platform. 13 participants (8 females) from Phnom Penh and various provinces including Siem Reap, Battambang, Prey Veng, and Kampong Cham attended the training. Most of them are citizen journalists and university freshmen.

The overreaching purpose of this Data Literacy for Public Health training is to stimulate data knowledge for participants through focusing on developing data understanding, utilizing and visualizing proficiently into daily personal and professional tasks, especially regarding the COVID-19 pandemic in Cambodia. Bearing this goal in mind, the training aimed to enable participants to integrate data into stories that could reach a wider public outreach.
The training started with a remarkable opening speech by Mr. Thy Try, Executive Director of ODC. Mr. Try started by allowing all participants to introduce themselves to each other which would be beneficial for them to learn, work together, and revealed the expectations of the workshop that all participants would gain skills and knowledge in understanding and visualizing data. In the remark, Mr. Try further portrayed the essential roles of data in public health and how it can be used to disseminate information to the public.
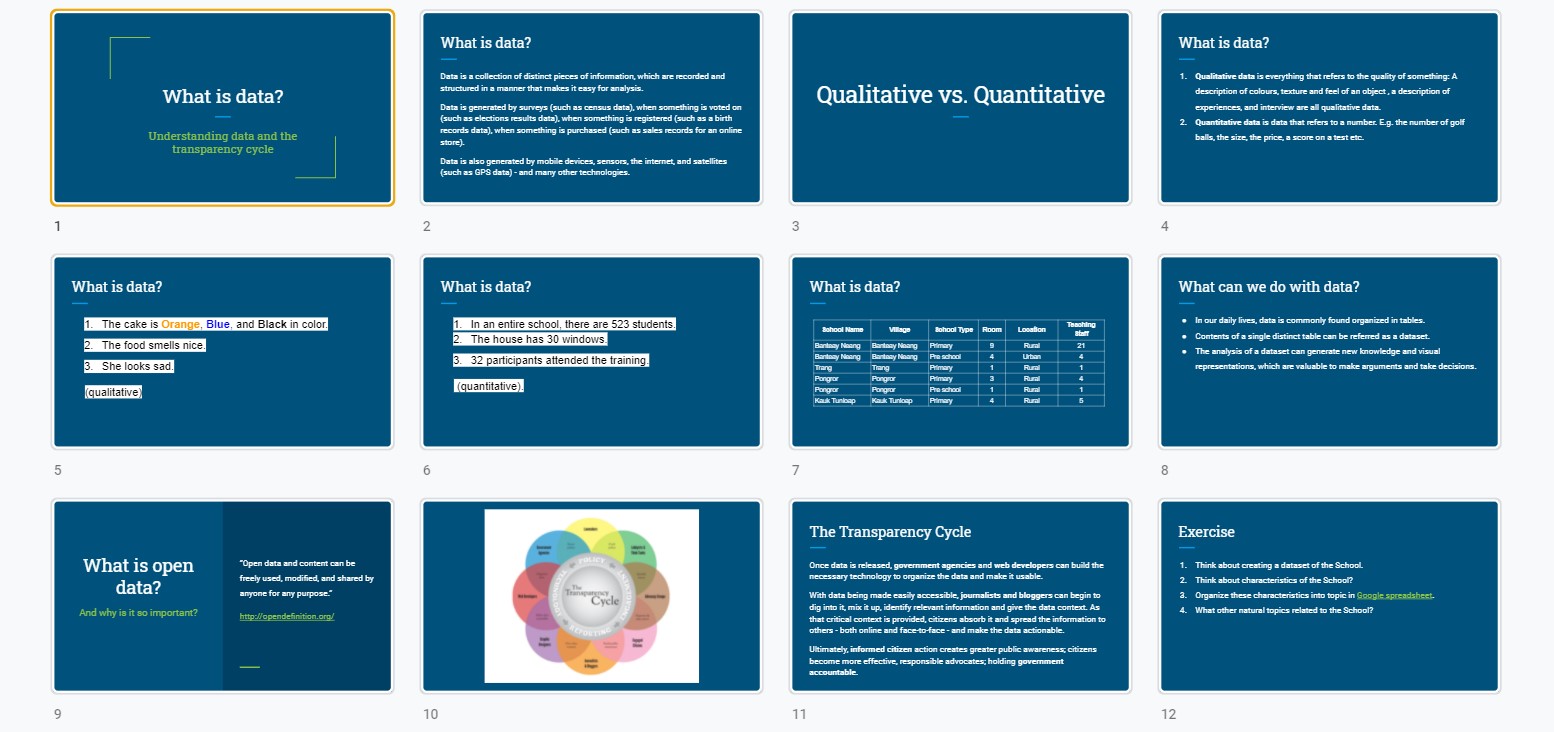
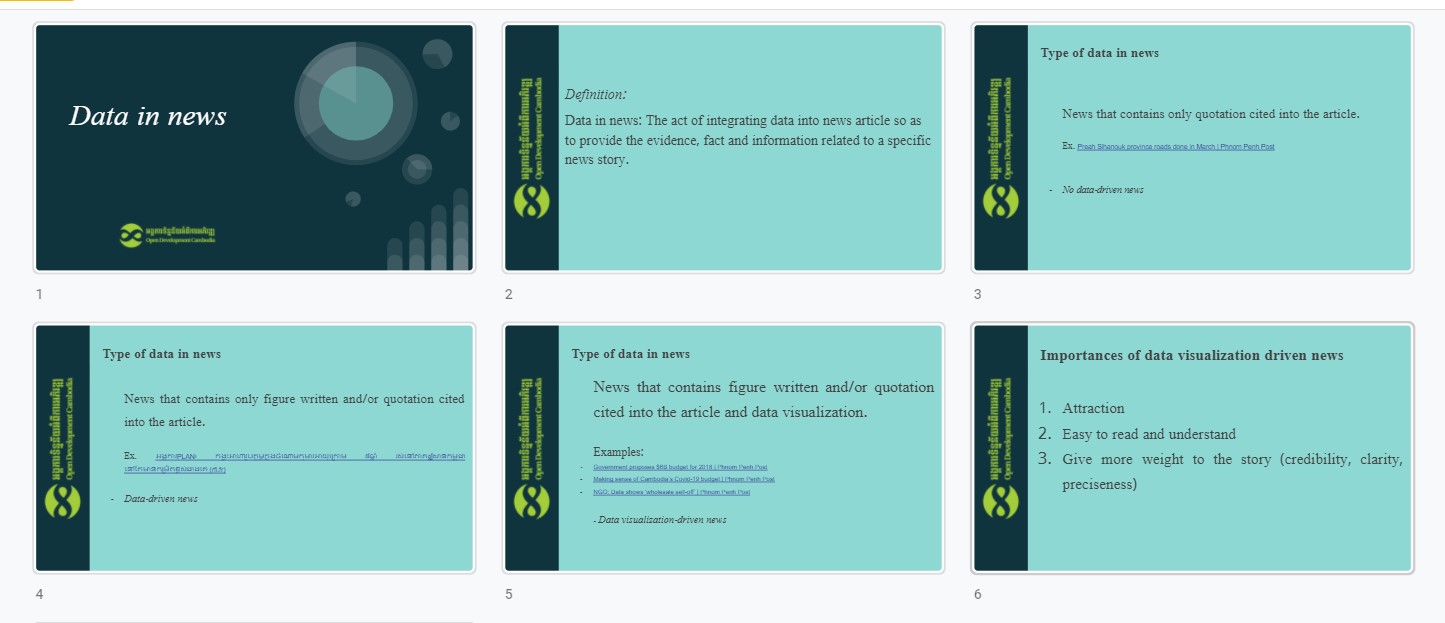
After the remark, the first session of the training was conveyed by Mr. Heang Kosal, an Economic editor-researcher of ODC. In his session, Mr. Kosal presented the general principle of data, the basic concepts of data types, mainly qualitative and quantitative data, the definition of open data and its importance, and the transparency cycle of open data. After finishing the first session, he continued to present on Data in News by emphasizing the basic definition of it, types of data in news, and understanding the importance of data visualization in data-driven news. The purpose was to instill participants’ ability to be well realized of data in daily life and what can be used with data, particularly identify the differences between what is reader-friendly news and what is not.
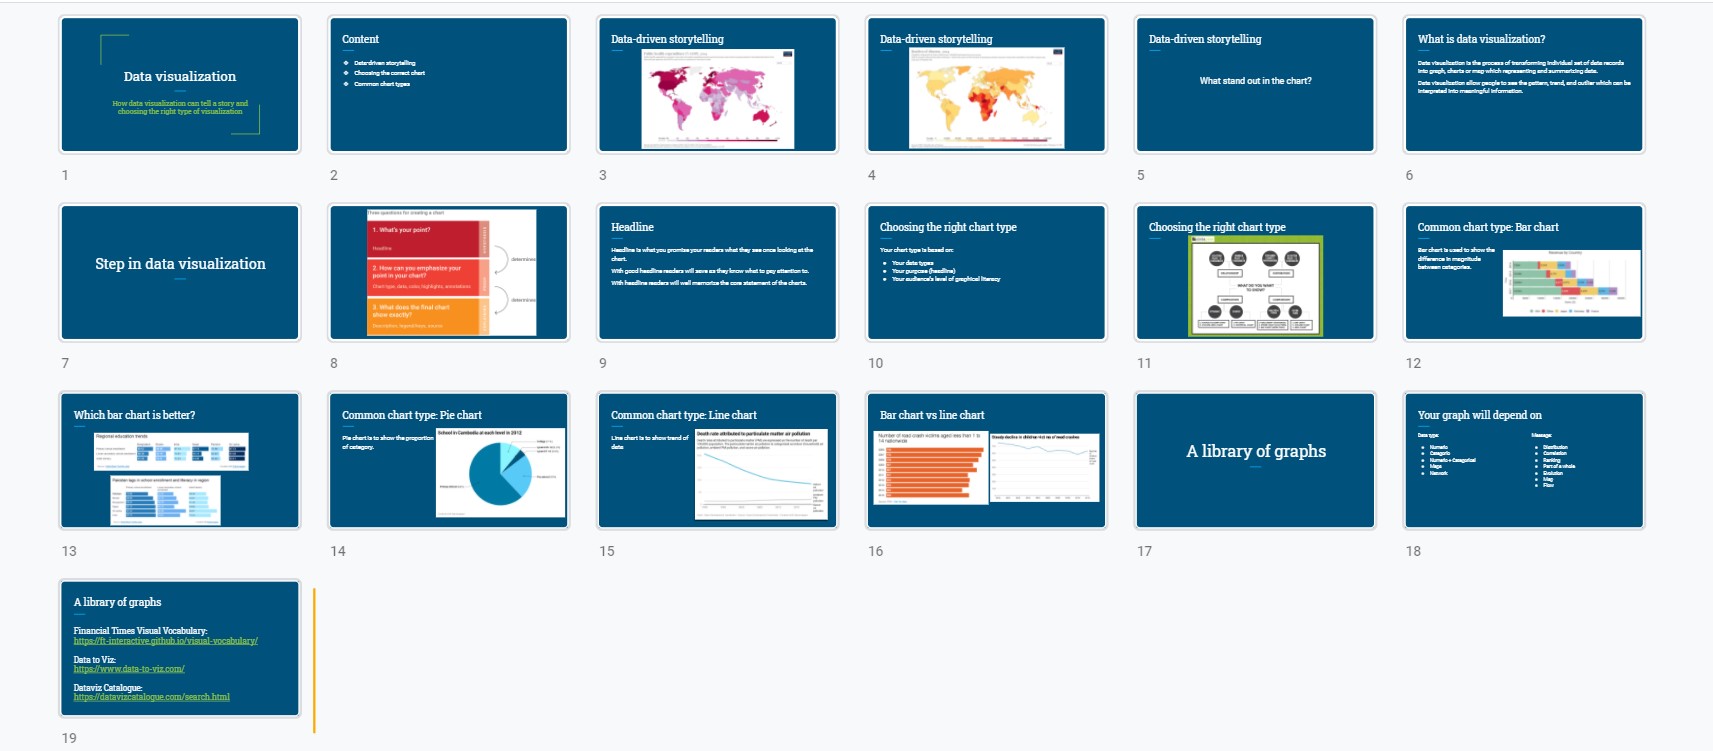
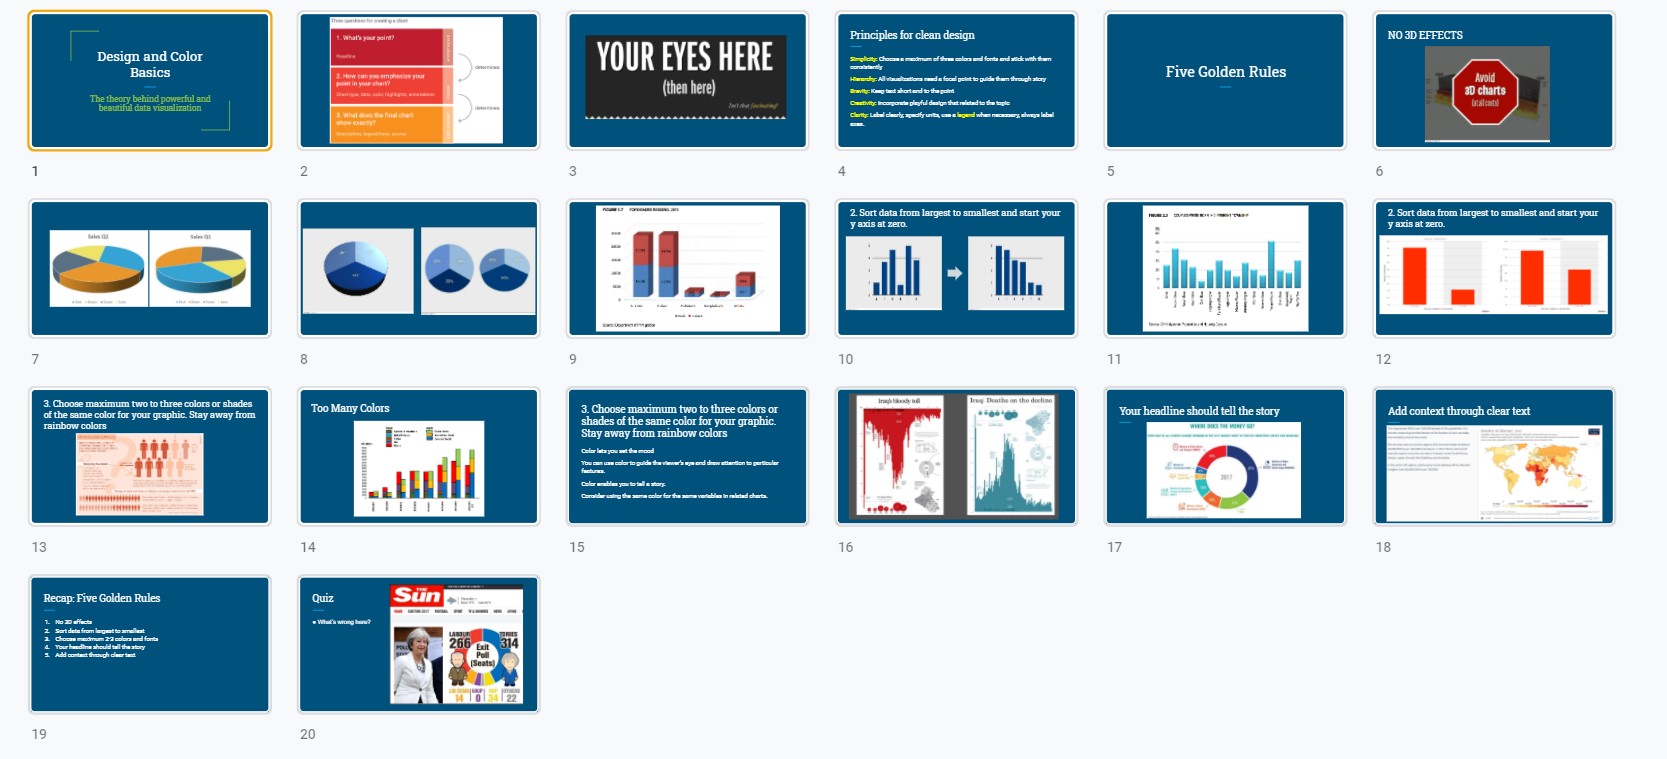
The next session was followed by Mr. Vong Pisith, Senior Data Research and GIS Officer of ODC. He presented the general principle of data visualization, focusing on its power to channel complex stories to audiences. In his session, he gave a comprehensive explanation of how data visualization can tell a story and a proper way to choose the right chart types to explain data. Participants also learned about the different types of data visualization that relevant to different topics of the stories. Step by step, he emphasized this session by clearly explain about the process of how to create standard data visualization using Datawrapper, an online data visualization tool. Besides learning how to use this tool, he also included a hands-on exercise, which allows audiences to practice what they have learned during his session. That’s wrapped up day one of the training successfully.
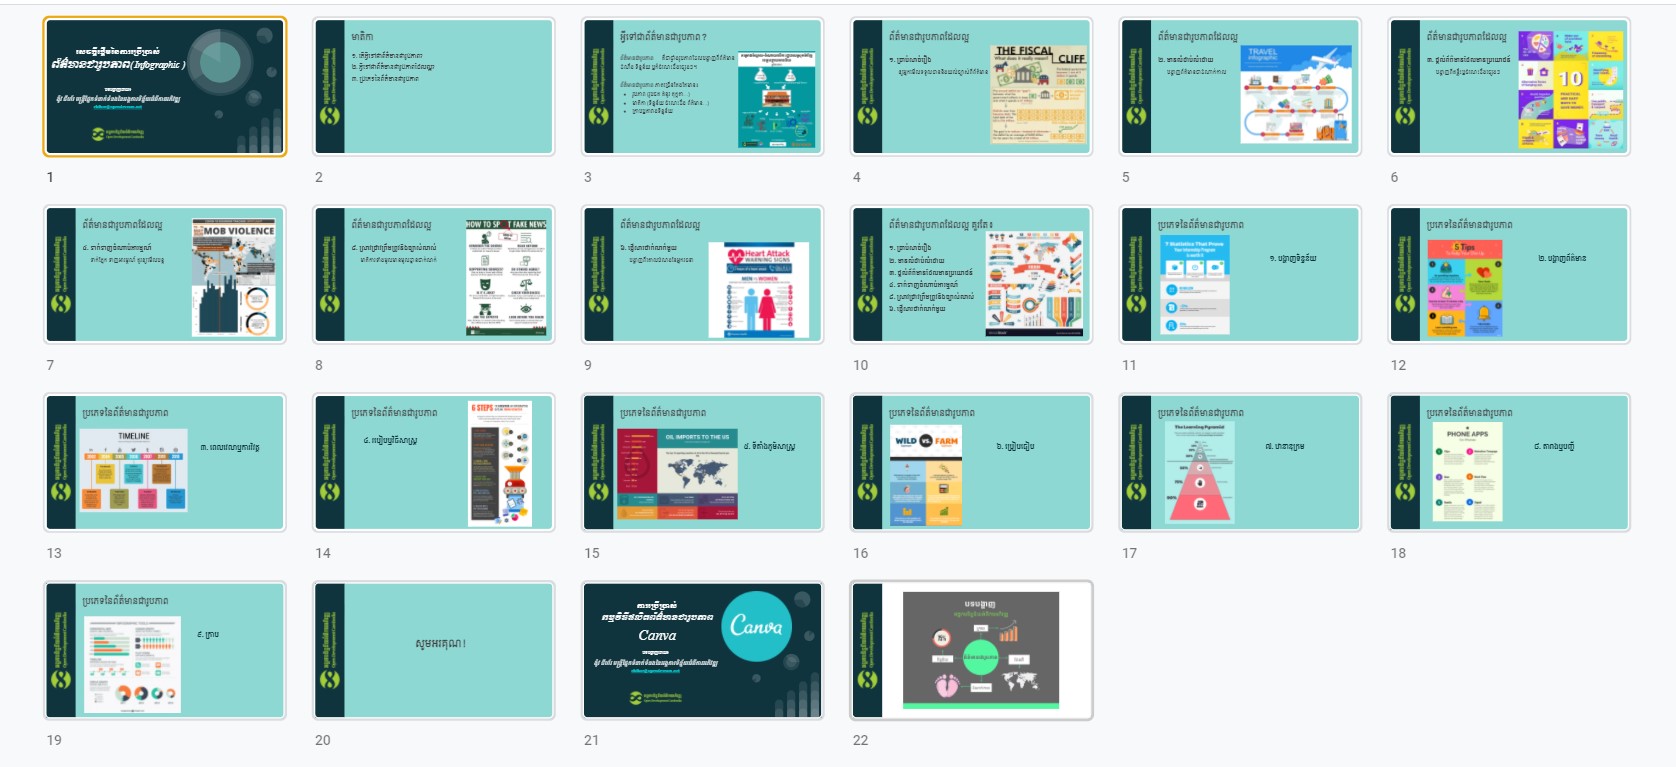
The second day of training began with the unfinished exercises of data visualization from the first day of the training. Mr. Pisith explained more to those who did not clearly understand and gave some more time and exercises to the participants to practice. Then, Mr. Ngov Chihor, Communications Officer of ODC, presented infographics as an alternative to data visualization. He started to technically sharing the participants the definition of infographics, types of infographics, and points to reach standardization of infographics. Moreover, he introduced an online tool called Canva and provided advice on producing professional infographics that convey clear and insightful messages. After learning how the tool worked, he exposed the audience to some exercises to allow them to practice Canva and create their own infographics.
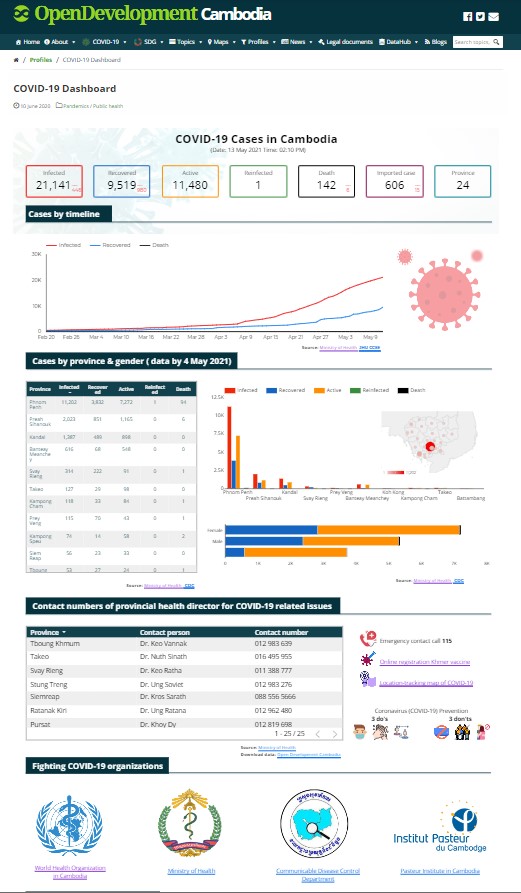 On the last day of training, ODC team instructed all participants into groups. The highlight of data knowledge of the training was in a group activity, in which participants applied the skills and knowledge acquired throughout the workshop into real-life practices. The ODC team provided guidance for them to work on public health data, specifically on COVID-19 data in Cambodia. The participants started to develop those data into data stories with interactive charts and their short descriptions. It was exciting to witness the hard work participants have put in and how they applied those skills gained to use on data. All groups required to work collaboratively together to produce their output and presenting to show their hard work in order to get some rewards for their efforts, time, and contribution.
From this three-day training, significant improvement in data has shown from the comparison between the pre-test and post-test survey of the participants. From the pre-test survey, no one managed to pass the test. However, more than 50% of the participants passed the post-test survey. Their score improved which implied that the overall data understanding, knowledge, and technical skills of participants substantially developed as a result of the training. Overall, based on the evaluation survey, the participants expressed their satisfaction with the training, and a participant has thanked ODC for the opportunity to join the event as it allows him to use this knowledge to create more charts, graphs, and infographics which are useful for his academic life.
Blog is written by: Mr. Than Davit, ODC Research Intern.
Read more blogs:

