Second training: Data literacy for public health
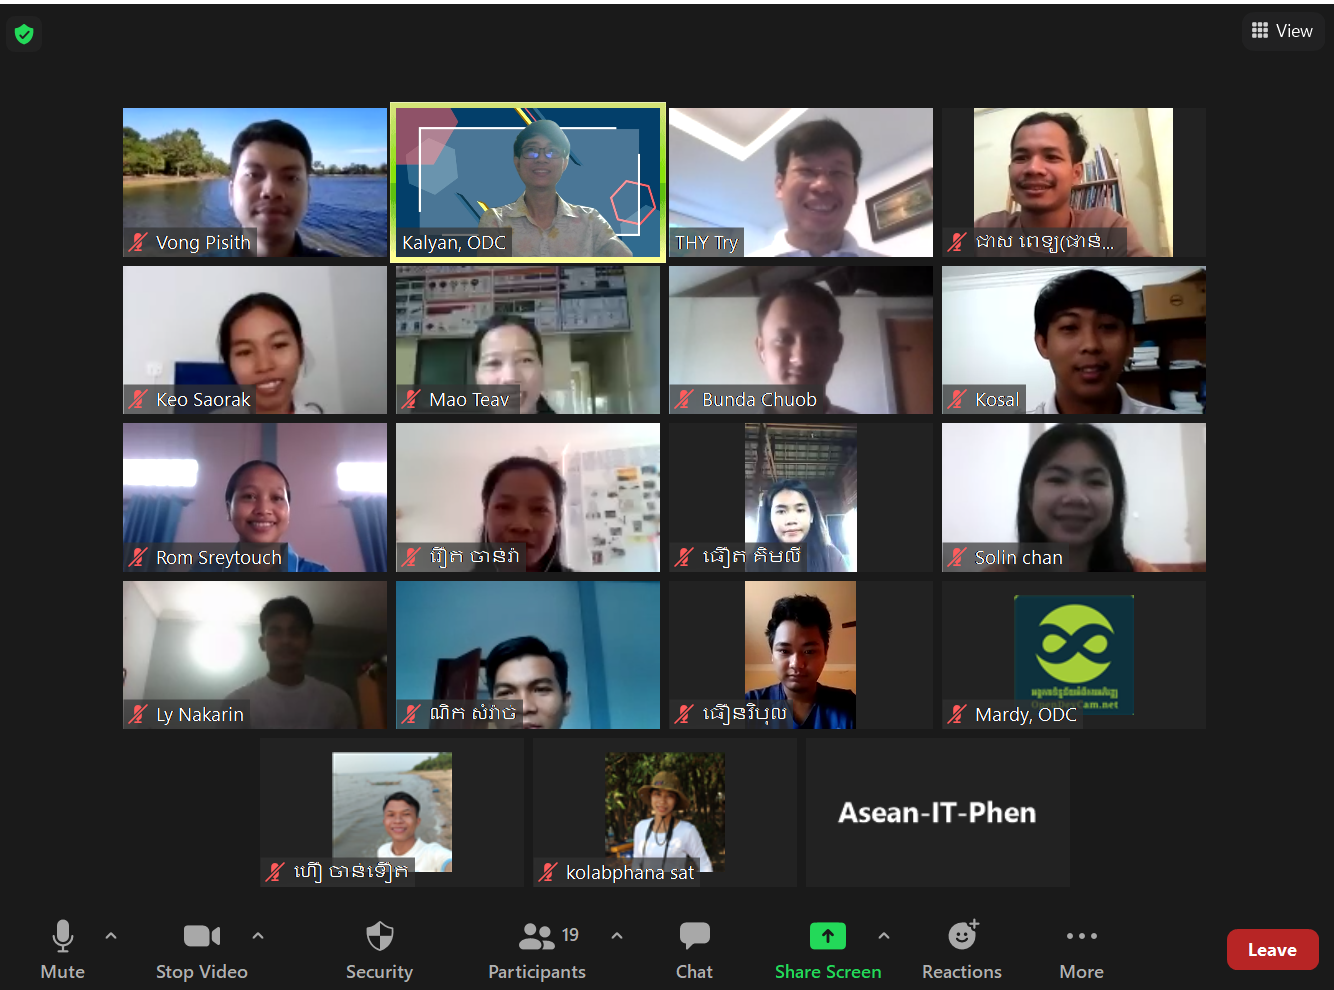
On 5, 6, 8, and 9 April 2021, Open Development Cambodia (ODC) has successfully conducted a four-day training under the theme “Data Literacy for Public Health”. This is their second training under this theme. The event was hosted by ODC team and conducted virtually via Zoom, a video conferencing platform due to the government measure to prevent the spread of the COVID-19 pandemic in the community. The event has hosted approximately 15 participants (8 females) who are identified as youth from the citizen journalist network from Siem Reap, Kampong Thom, Preah Vihear, Kampong Chhnang.
The main objectives of this data literacy for public health training was designed to enhance participants’ capacity on data knowledge in Cambodia by shifting their focus to data in order to utilize and visualize proficiently in their daily work. Moreover, the training also aimed to enable participants to transform data from different sources into stories that could reach a wider public audience.
The training started by the opening speech of Mr. Thy Try, ODC’s Executive Director. In his valuable remark, Mr. Try raised the importance of data and its potential benefit and call on all participants to grasp as much knowledge as possible during training. After that, the introduction session is continued to allow all participants to get to know each other so that they can learn, work together, and revealed their individual expectations from this training. Mr. Try also portrayed the crucial role of data in public health and how it can be used to disseminate information. In this regard, he further highlighted the potential and impact of using data in public health, especially during the COVID-19 pandemic in Cambodia.
The first session of the training was delivered by Mr. Heang Kosal, an Economic editor-researcher of ODC. In this warm-up session, Mr. Kosal presented the general definition of data, the basic concepts of data types, mainly qualitative and quantitative data, the definition of open data and its importance, and the transparency cycle built upon open data. After finishing the first session, he continued to present about the formation of data in news by focusing on the basic definition, types of data in news, and understanding the importance of data visualization in news. The purpose was to instill participants’ ability to recognize the data usage in their daily life.
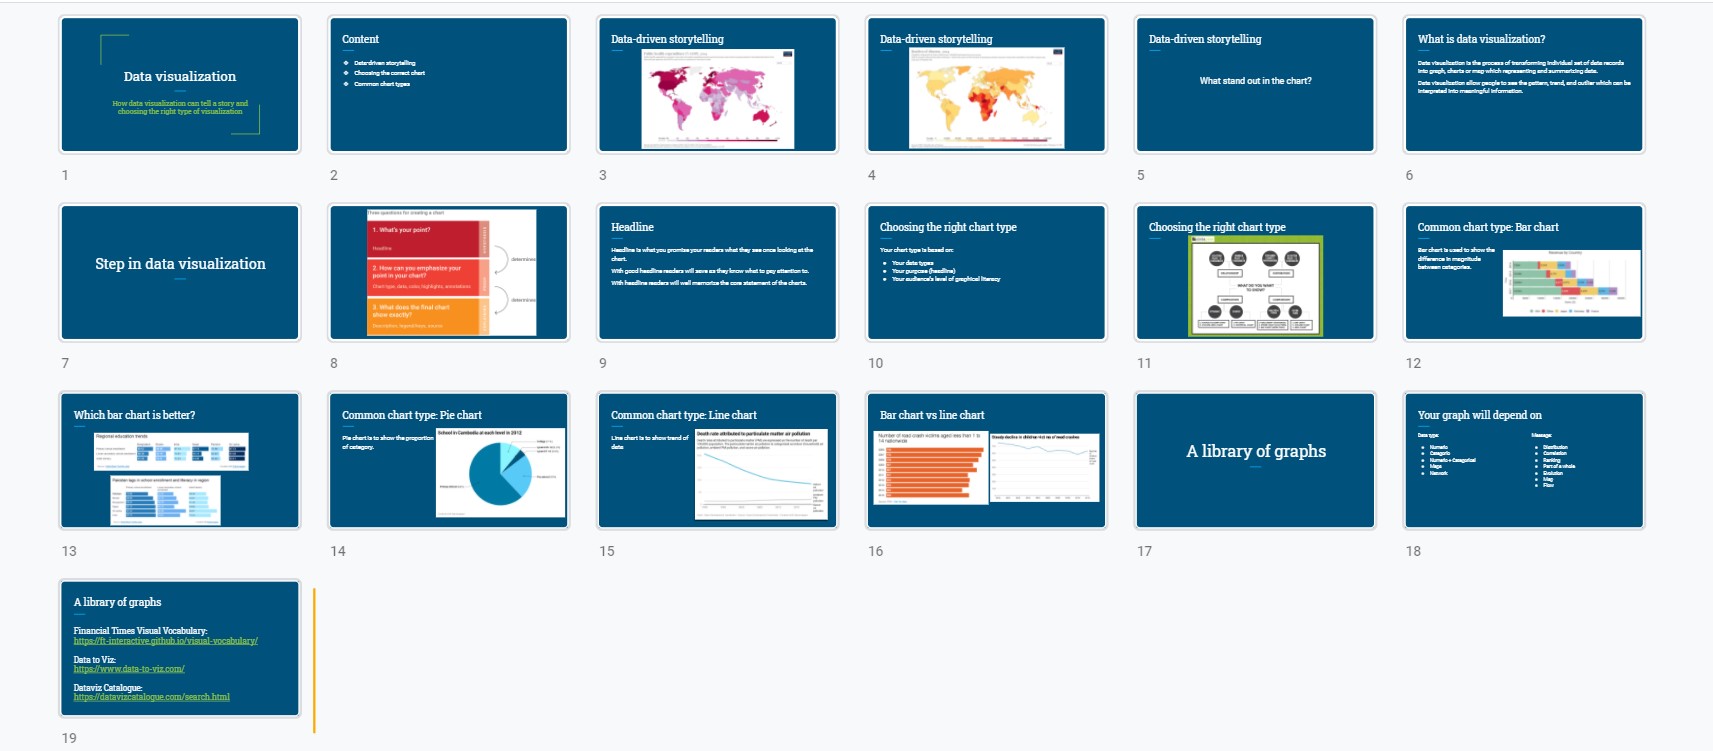
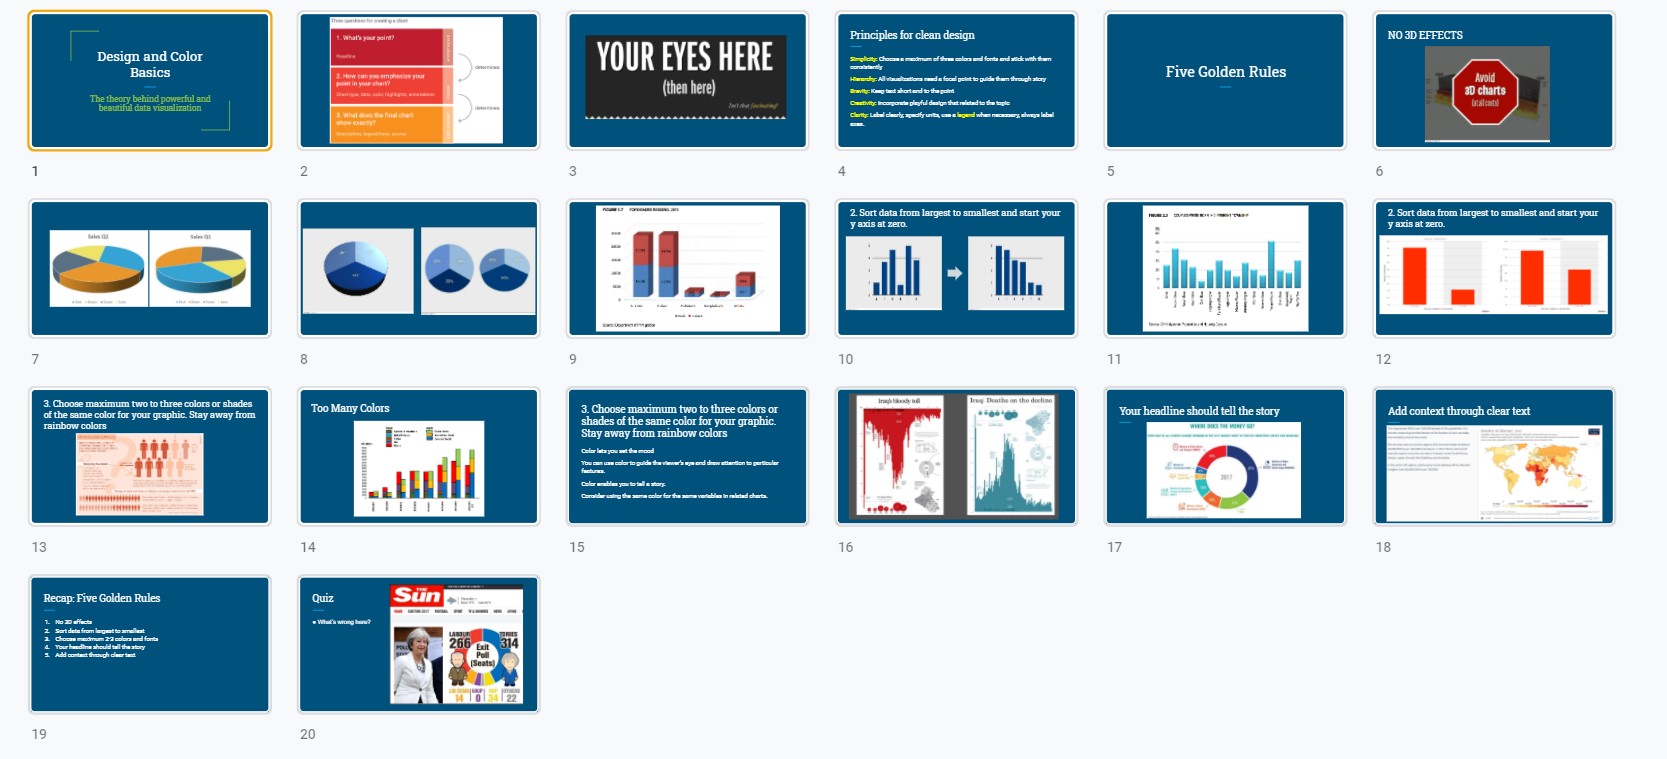
Mr. Vong Pisith, Senior Data Research and GIS Officer of ODC, was responsible to take charge over the next session on which he has presented the general principle of data visualization. In his session, he emphasized the more technical side of how data visualization can tell a story to readers and the way to choose the right chart types to explain data. After this sharing moment, audiences could learn about the standardization of data visualization relevant to the topic properly.
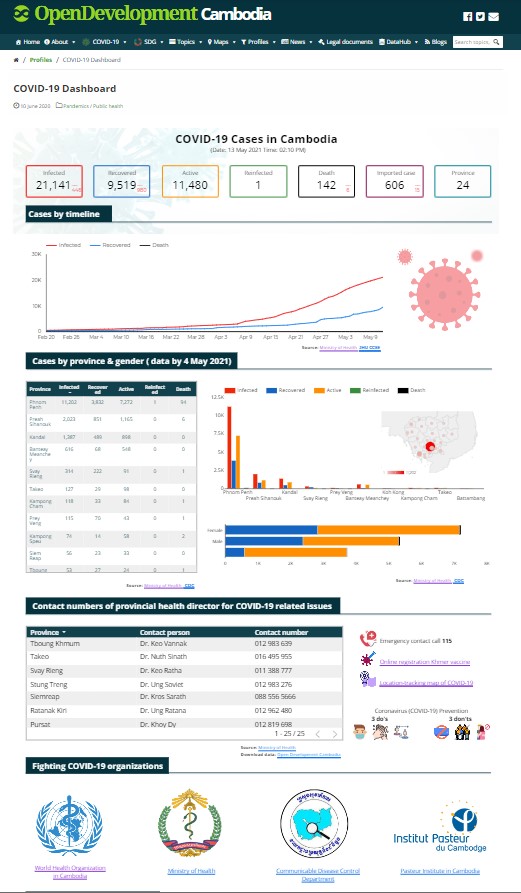
The second day began with the introduction on data visualization, presented by Mr. Pisith. The session focused on mentioning the vital importance of choosing the right type of charts that able to tell stories to the audiences. He took on this session by clearly explaining step-by-step to create standard data visualization using Datawrapper, an online data visualization tool. Besides learning how to use this tool, he also included a hands-on exercise, which provided participants a chance to practice what they have learned. The practice exercise mainly focuses on the COVID-19 pandemic in Cambodia.
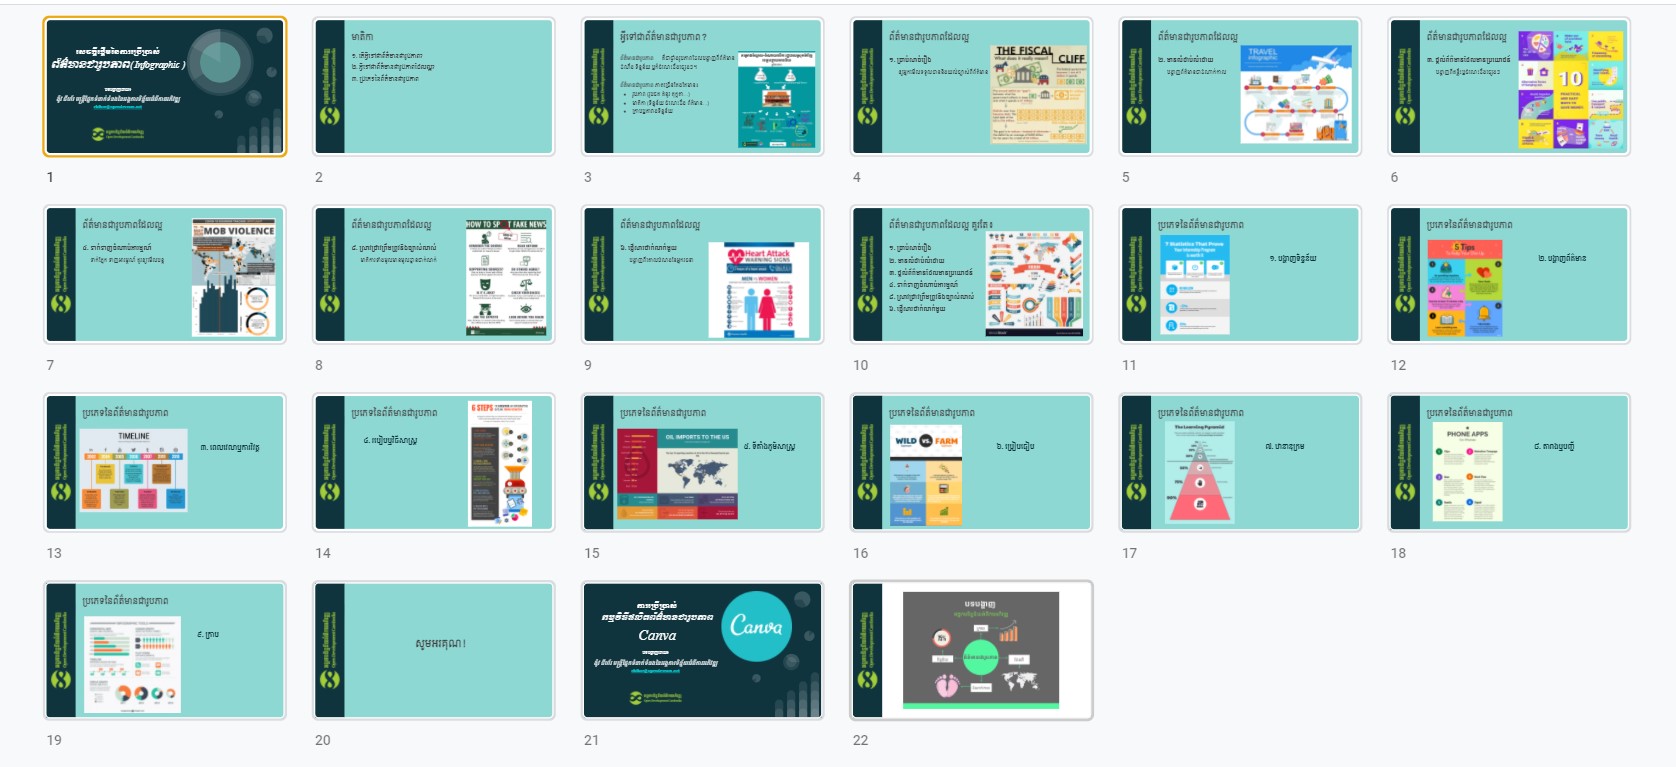
 On the third day of the training workshop, Mr. Ngov Chihor, Communication Officer of ODC, began by presenting a lesson on infographics as an alternative to visualize data. In this regard, the session started by introducing the participants to the basic definition of infographics, types of infographics, and points to reach the standardization of infographics. He has also introduced an online tool called Canva and provided advice on producing professional infographics that convey clear and insightful storytelling. After learning how the tool worked, he allowed participants to explore the tools and create their own infographics. Day three was concluded when each participant has produced their own infographic.
On the last day, the focus was shifted to group exercise. The purpose of the session was to make sure that participants are able to put what they have learned throughout the event into practice. Being practical would allow them to further increase their knowledge of data visualization. ODC team instructed all participants to work collaboratively in the groups. In the group activity, the ODC team asked them to work on public health data, particularly on COVID-19 data in Cambodia. They have developed those resources into different forms of data stories with charts and infographics. On top of that, all groups were requested to present and post their work on the Facebook group to get constructive feedback from both trainers and their peers.
According to the pre-test and post-test survey, participants show the improvement on their understanding of data, visualizing skills, data-story telling and basic knowledge of using different data visualization tools. Their score has been increase dramatically before and after the event. Based on these achievements and observation during the training, participants realized the impacts of storytelling in public and had more knowledge on using data for preparing and visualizing to create their standard stories. One participant has praised the event that it was very beneficial for a young citizen journalist like him to learn about data visualization and infographic and now after the training, he finally was able to create his own data visualization without the help of the others.
Blog is written by: Mr. Than Davit, ODC Research Intern.

