Supporting journalists through data visualization training
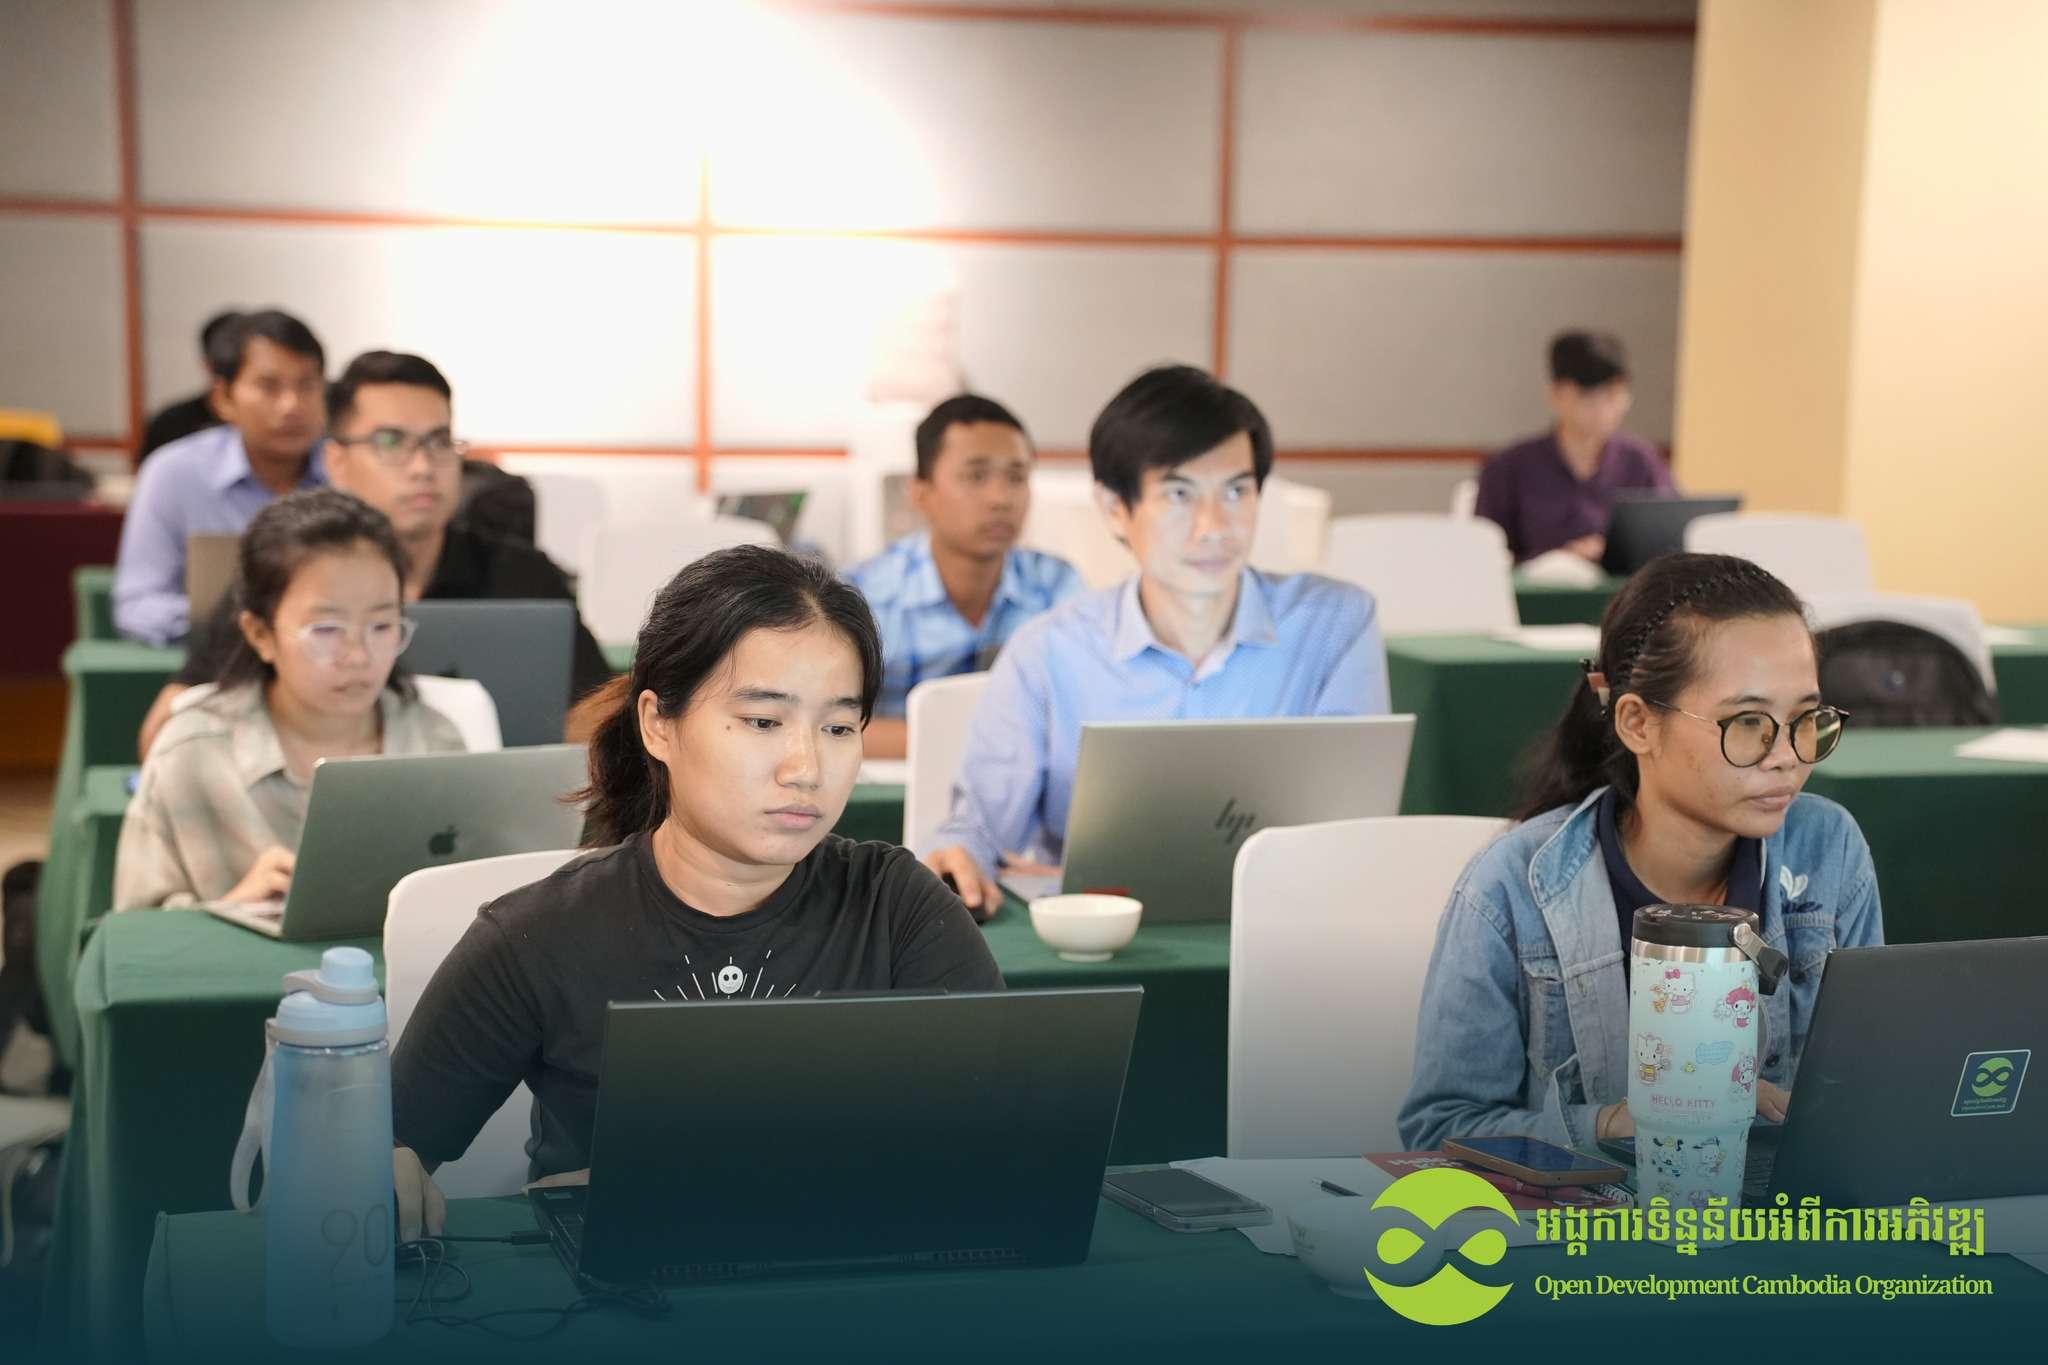
In today’s media landscape, where data and information overflows and attention lengths are short, journalists should use more than just words to make an impact. Data visualization is a powerful tool that enables journalists to tell compelling stories by converting raw data into meaningful, engaging visualizations. To equip journalists with this essential skill, Open Development Cambodia (ODC), with support from USAID Cambodia through FHI360 under the Civil Society Support Activity: Cluster Anchor Grants, conducted a two-day “Data Visualization in Journalism” training workshop in Phnom Penh on 29th and 30th August 2024 with a total of 13 trainees and 7 trainers and facilitators.
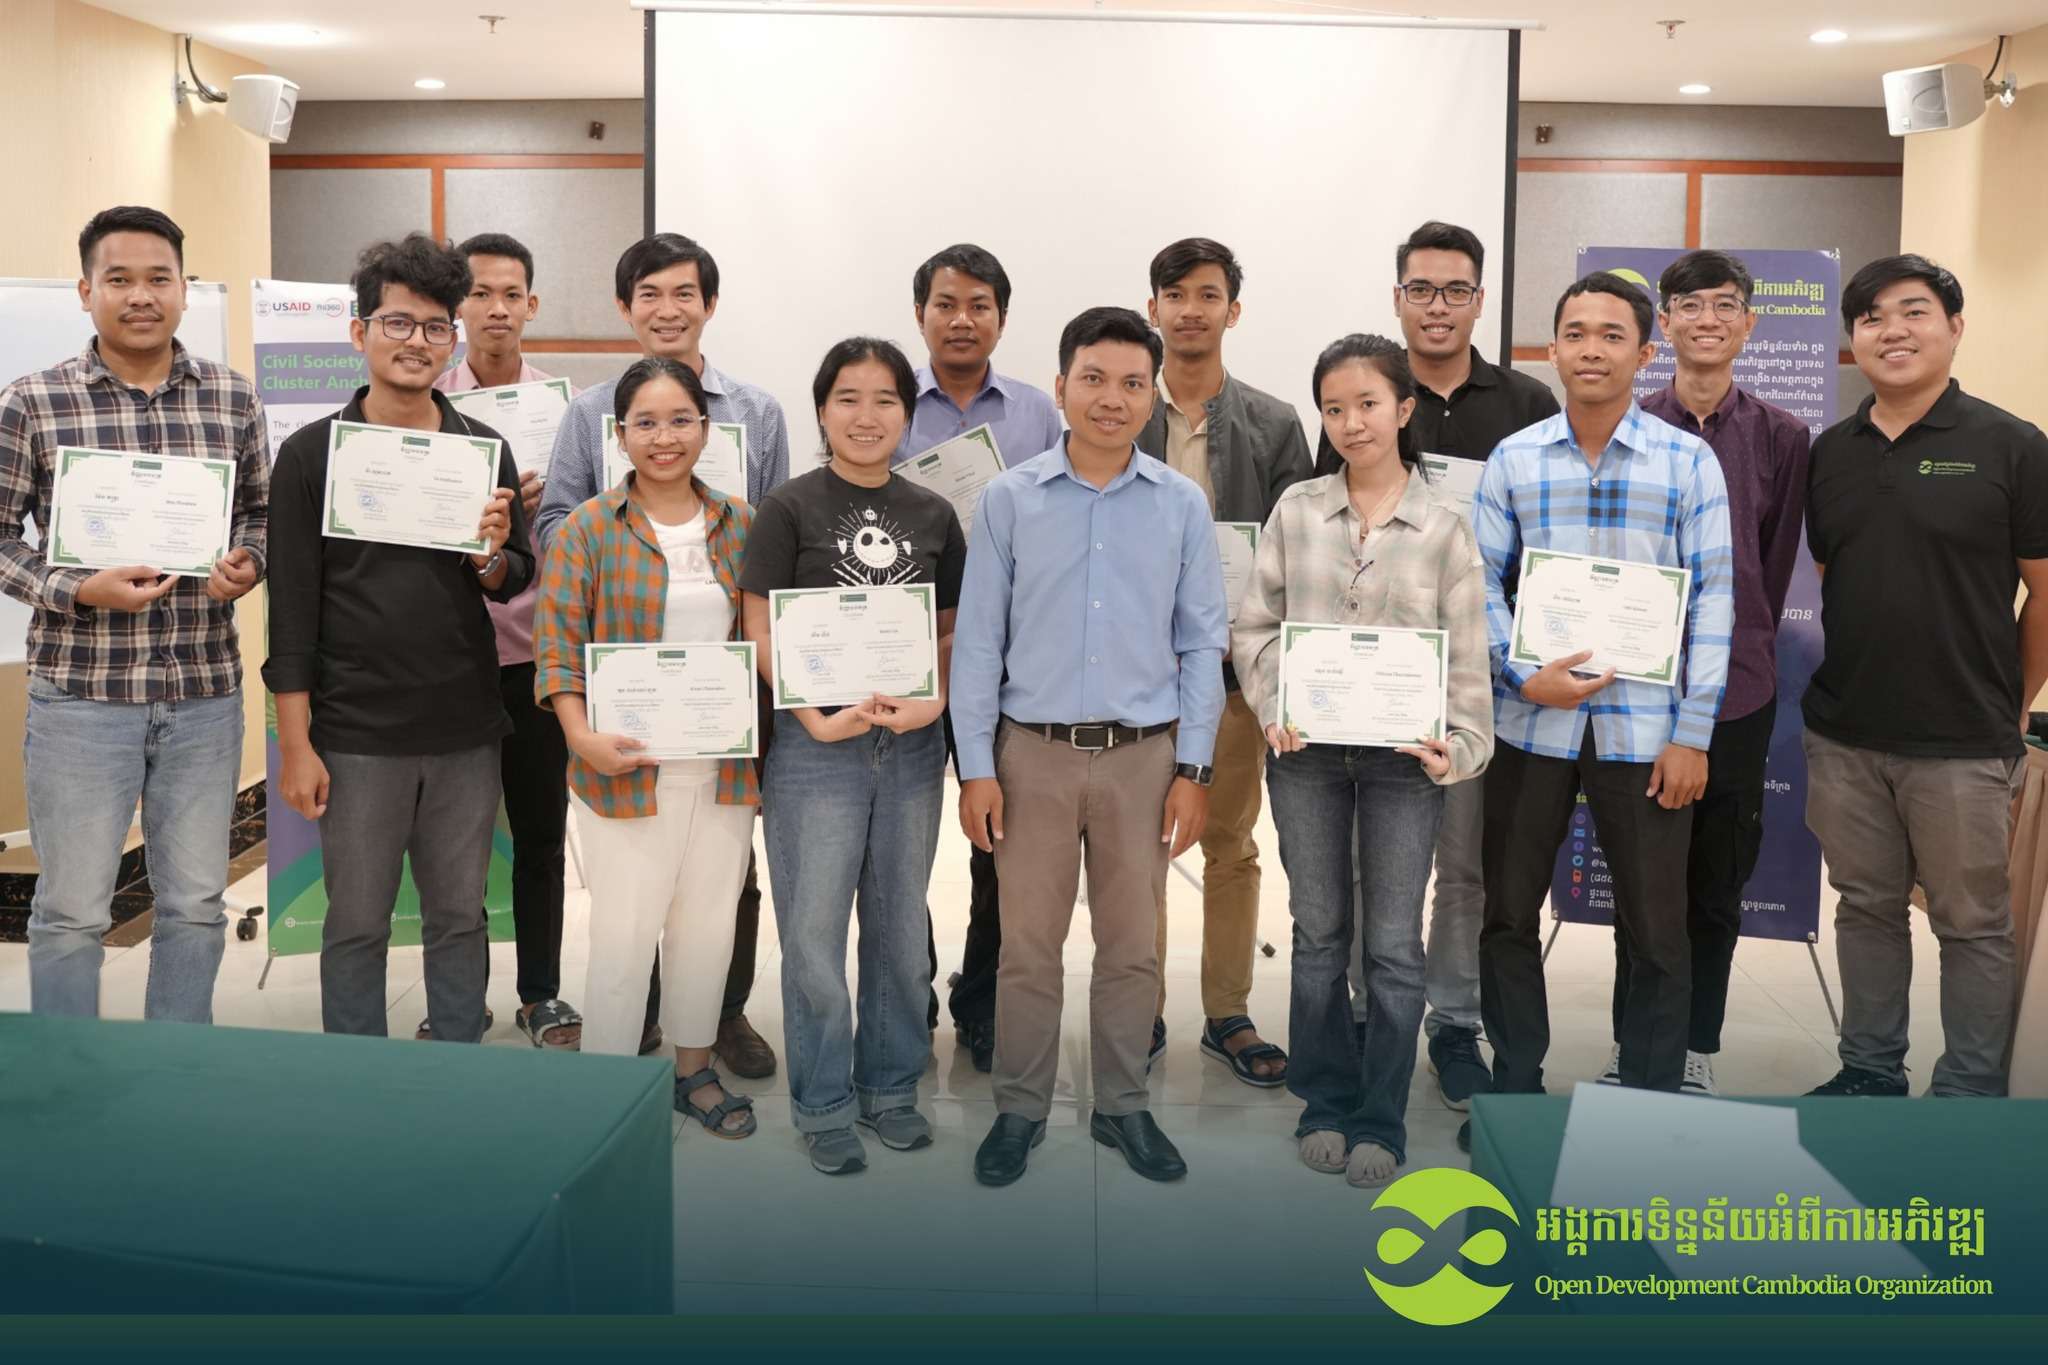
This training was proposed for journalists who want to advance their skills to present data-driven stories. With a focused agenda, the training was conducted to be a hands-on experience that allowed participants to immerse themselves in the world of data visualization.
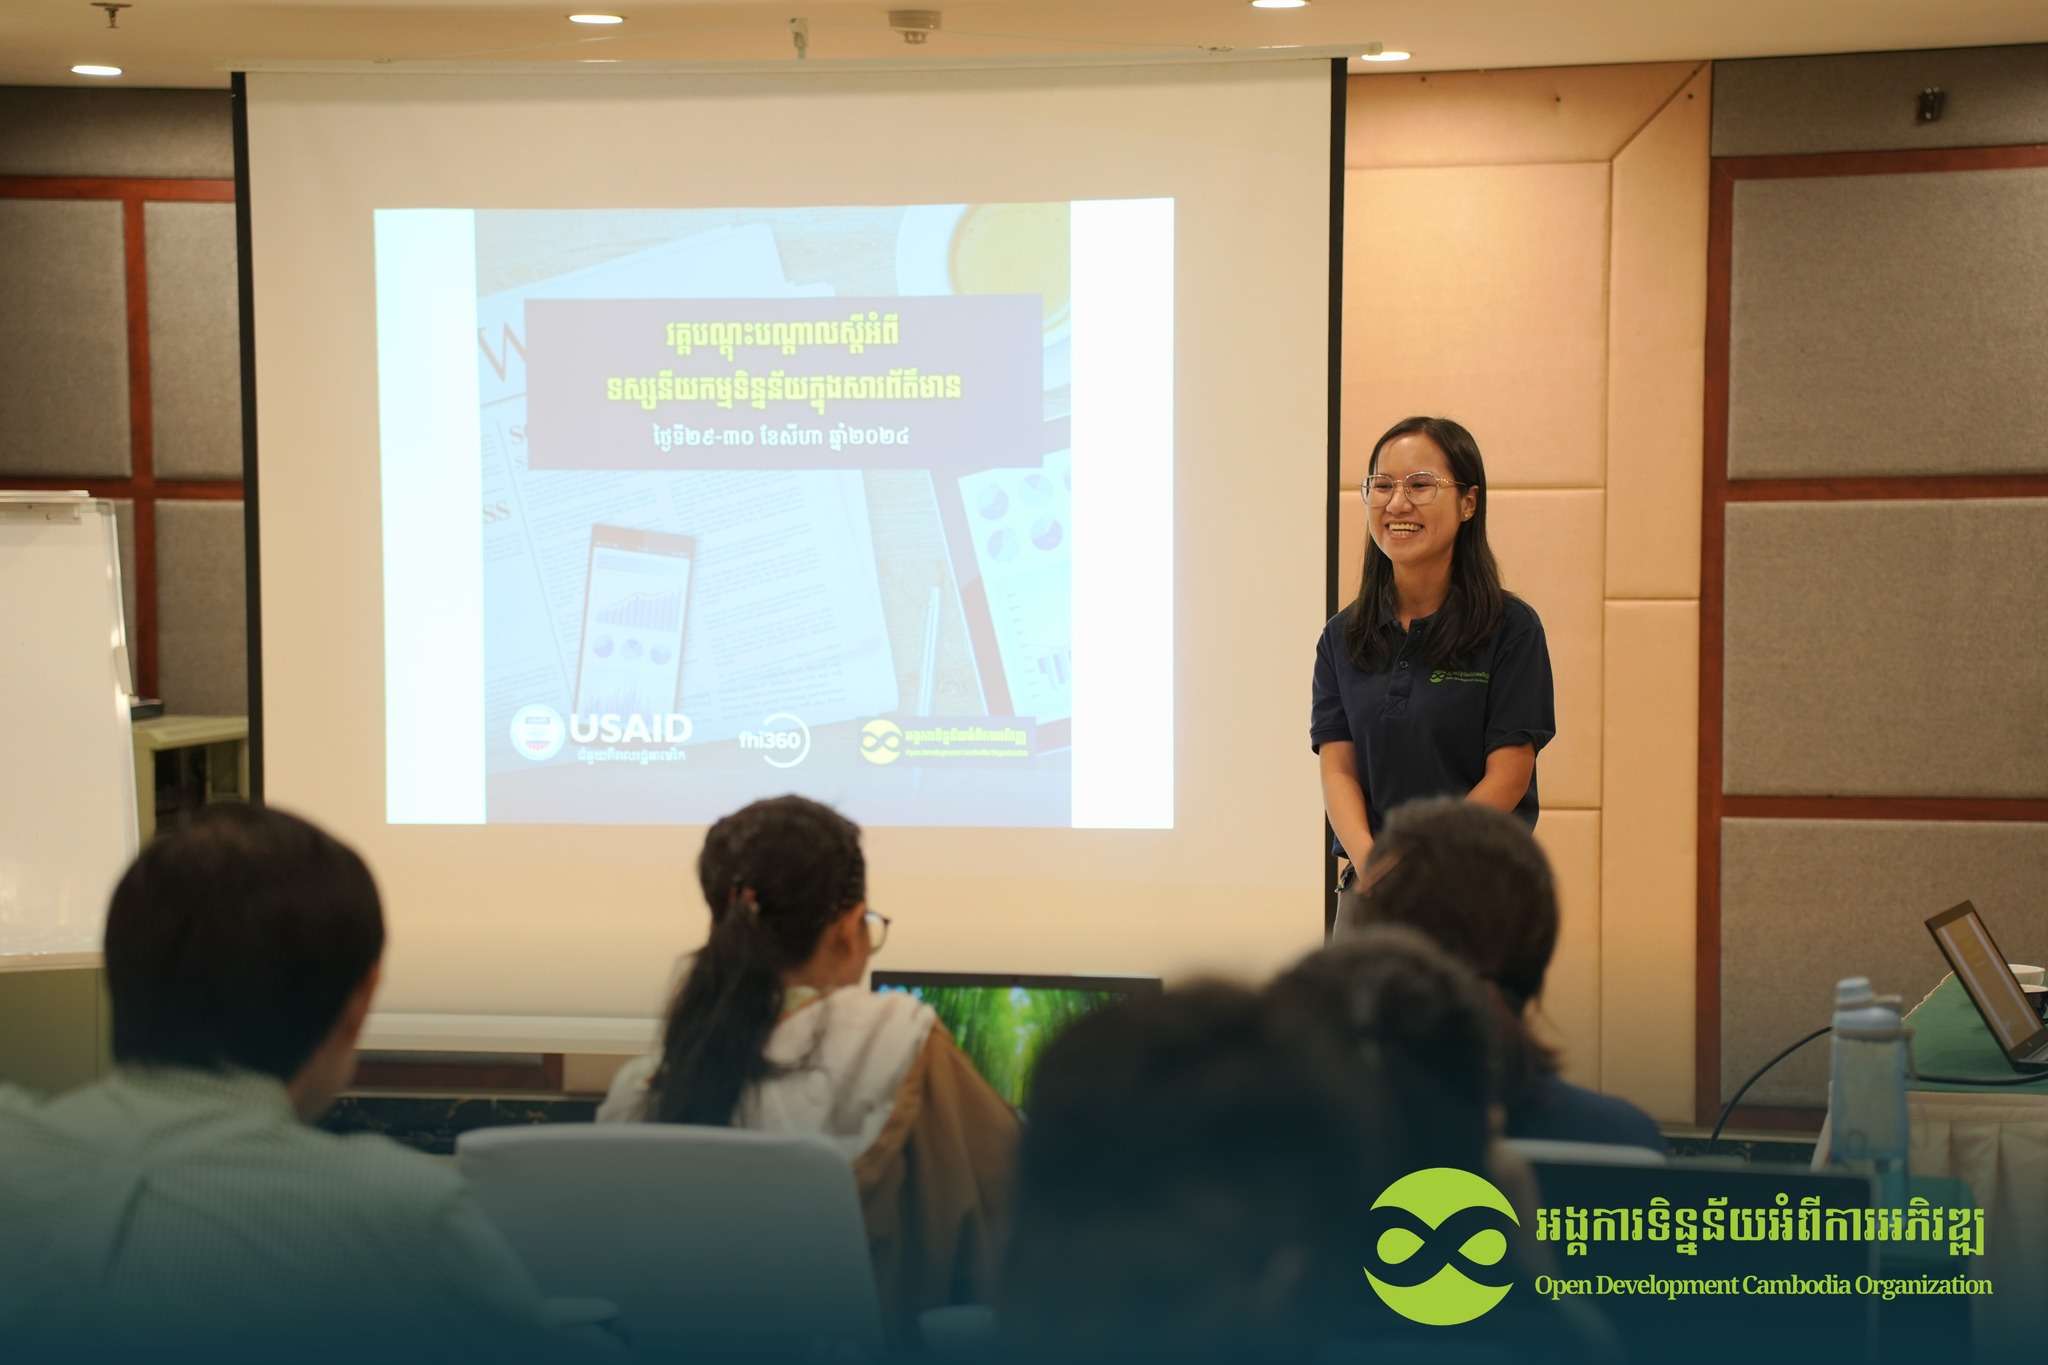
Day 1: Foundations of data visualization
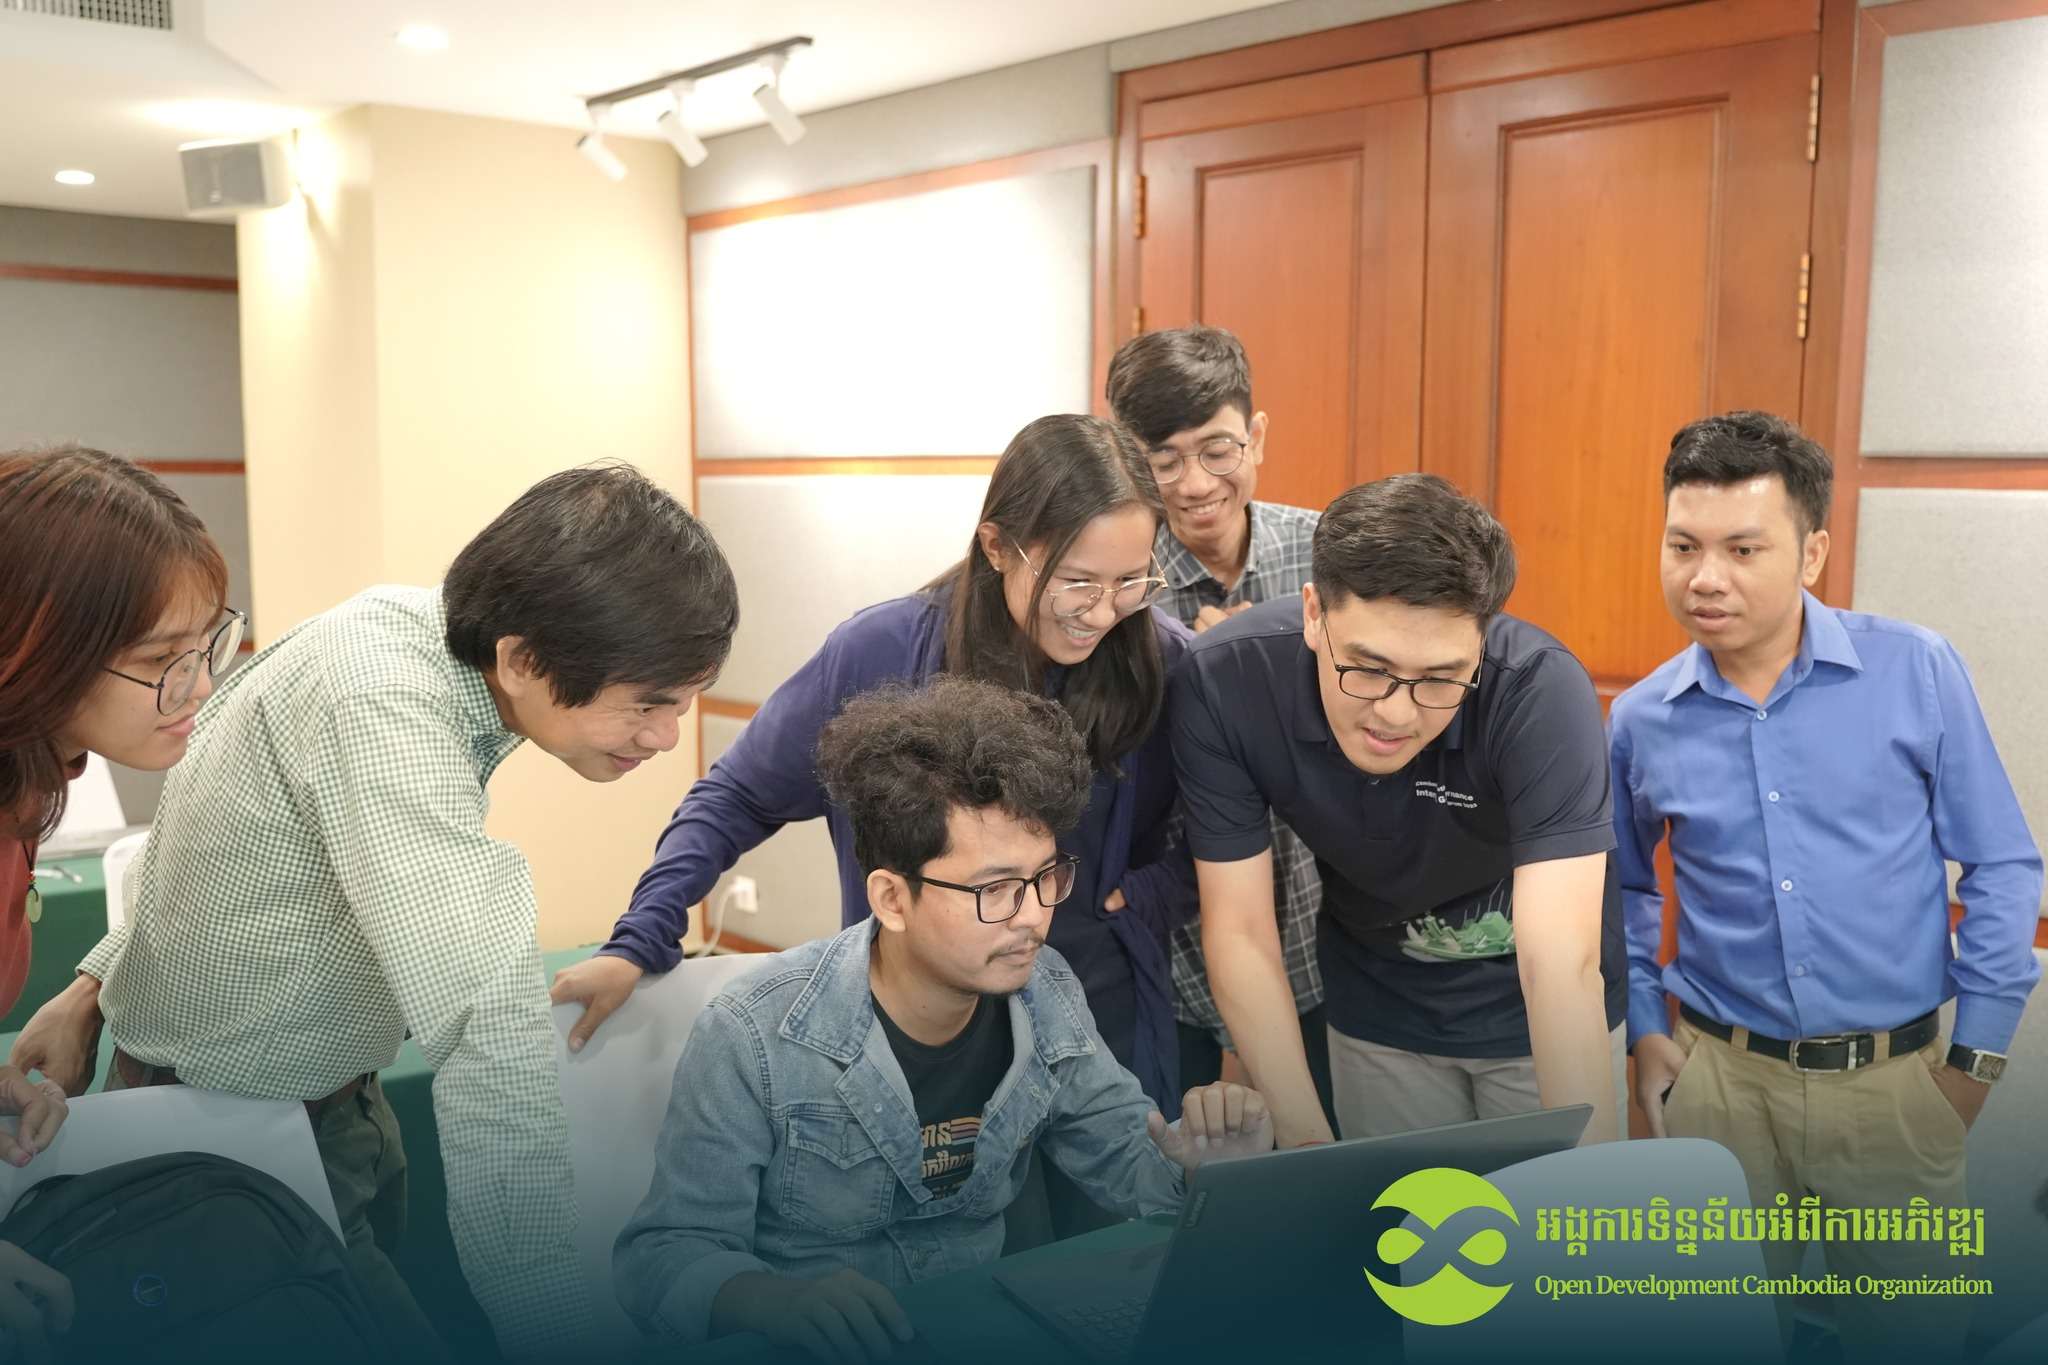
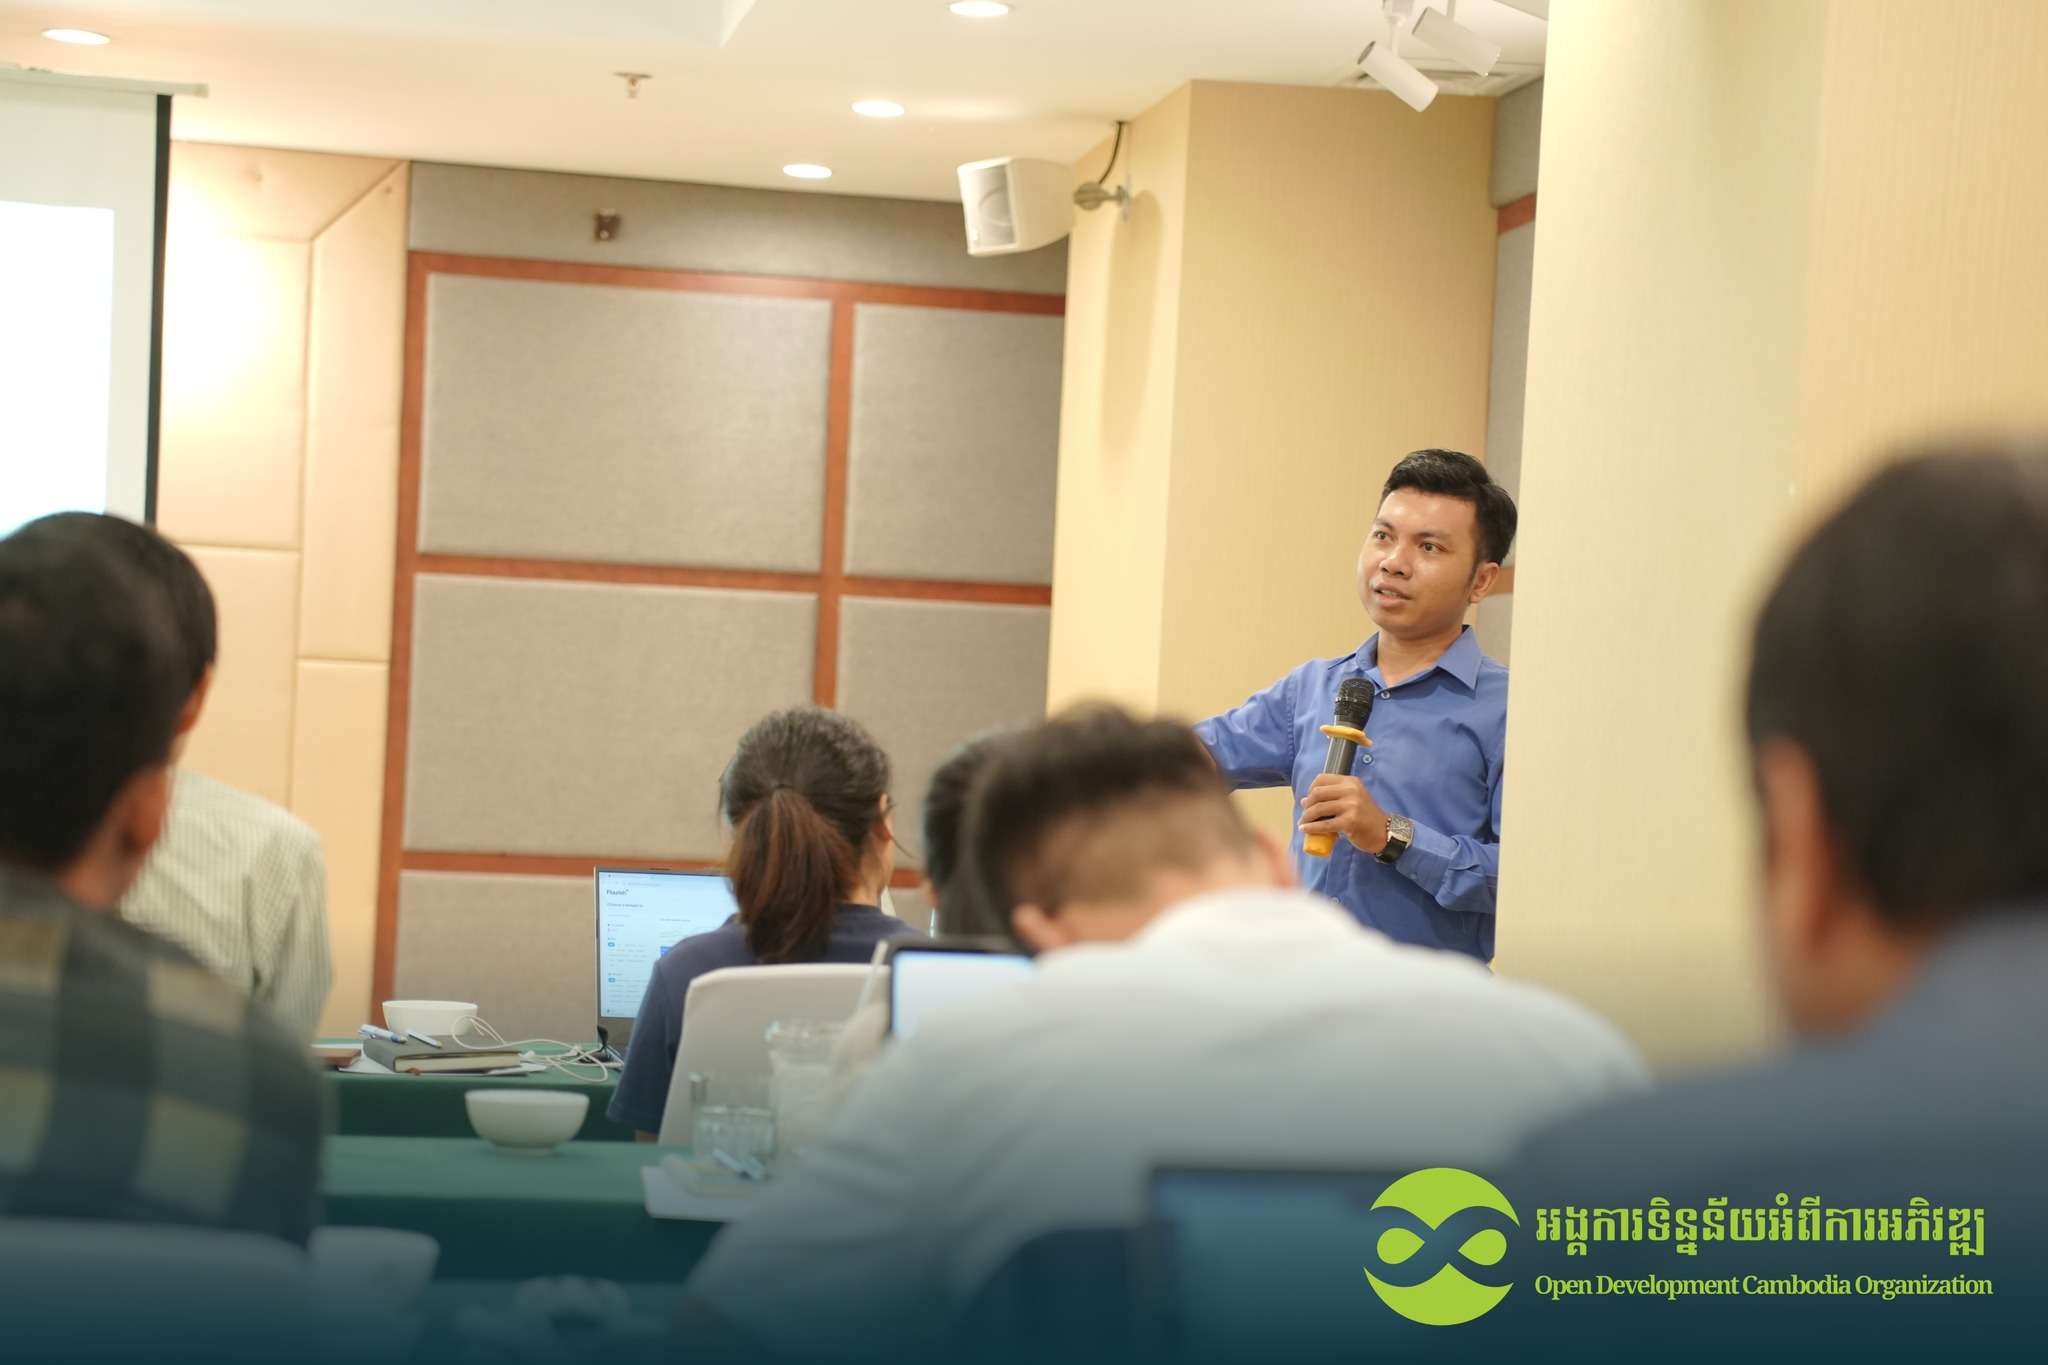
The first day began with registration and ODC Program Coordinator’s welcome speech, followed by participants’ self-introductions and a pre-test to assess their initial knowledge. The morning sessions, led by ODC data literacy experts covered data understanding, data visualization principles, and an introduction to the Flourish tool for creating visualization stories. The afternoon included hands-on group exercises in which participants will practice creating visualizations, reflect on their group work, and then move on to individual practice with Flourish, allowing them to refine their new skills.
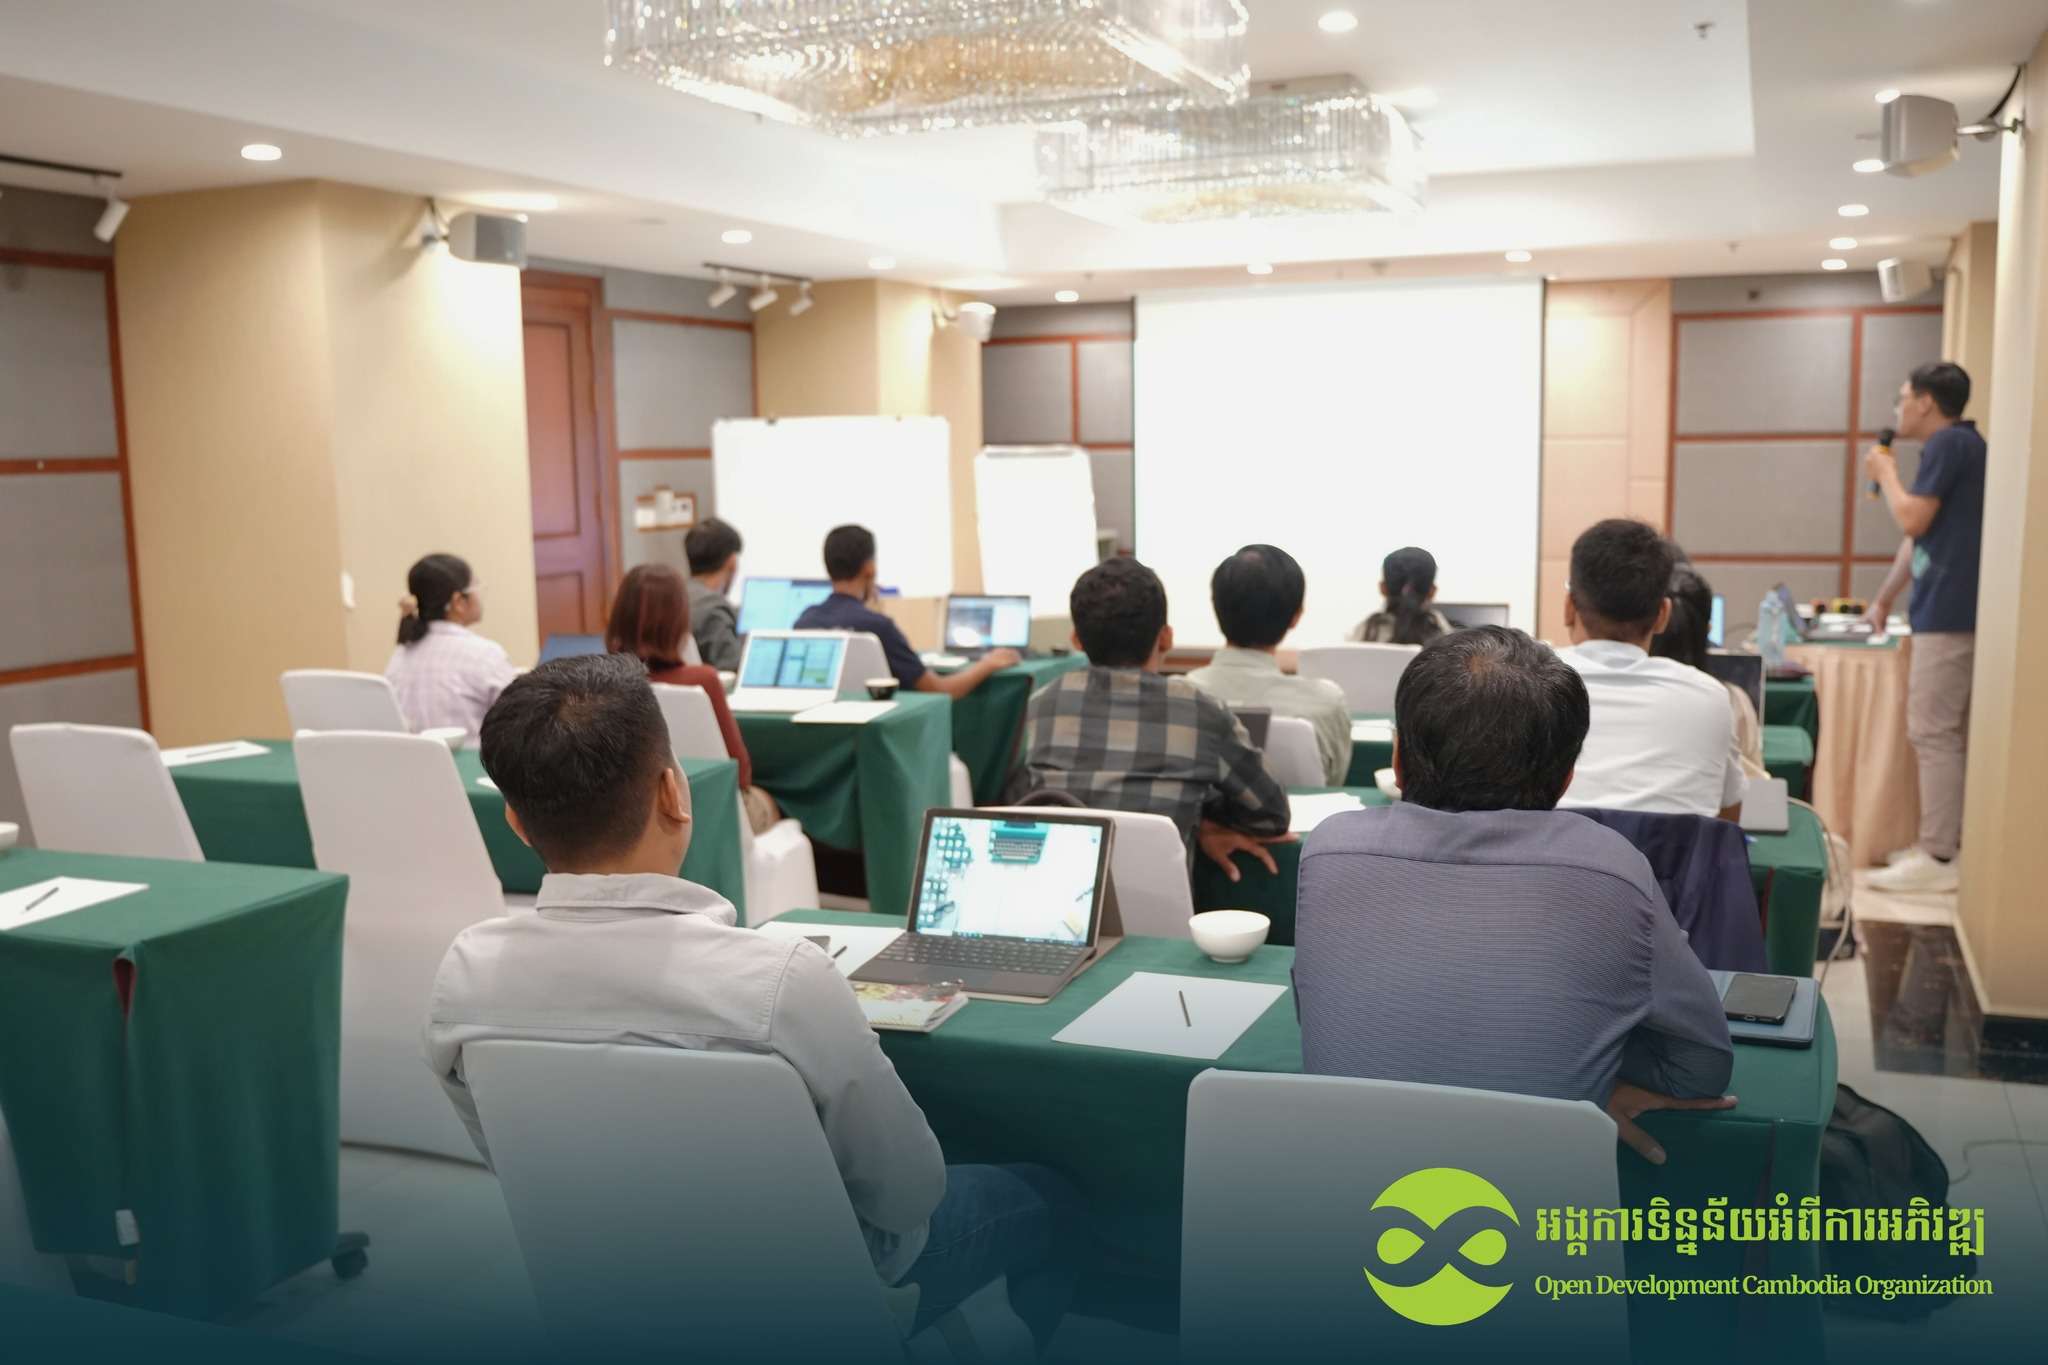
Day 2: Practicing data-driven storytelling
The second day was keen on data storytelling, with hands-on sessions for creating innovative visualizations such as scatter plots and treemaps. Trainees continued to practice individually and in groups, gaining deeper insights into creating data storytelling. The training was concluded with a post-test, evaluation, and final reflection on what was learned over the two days.
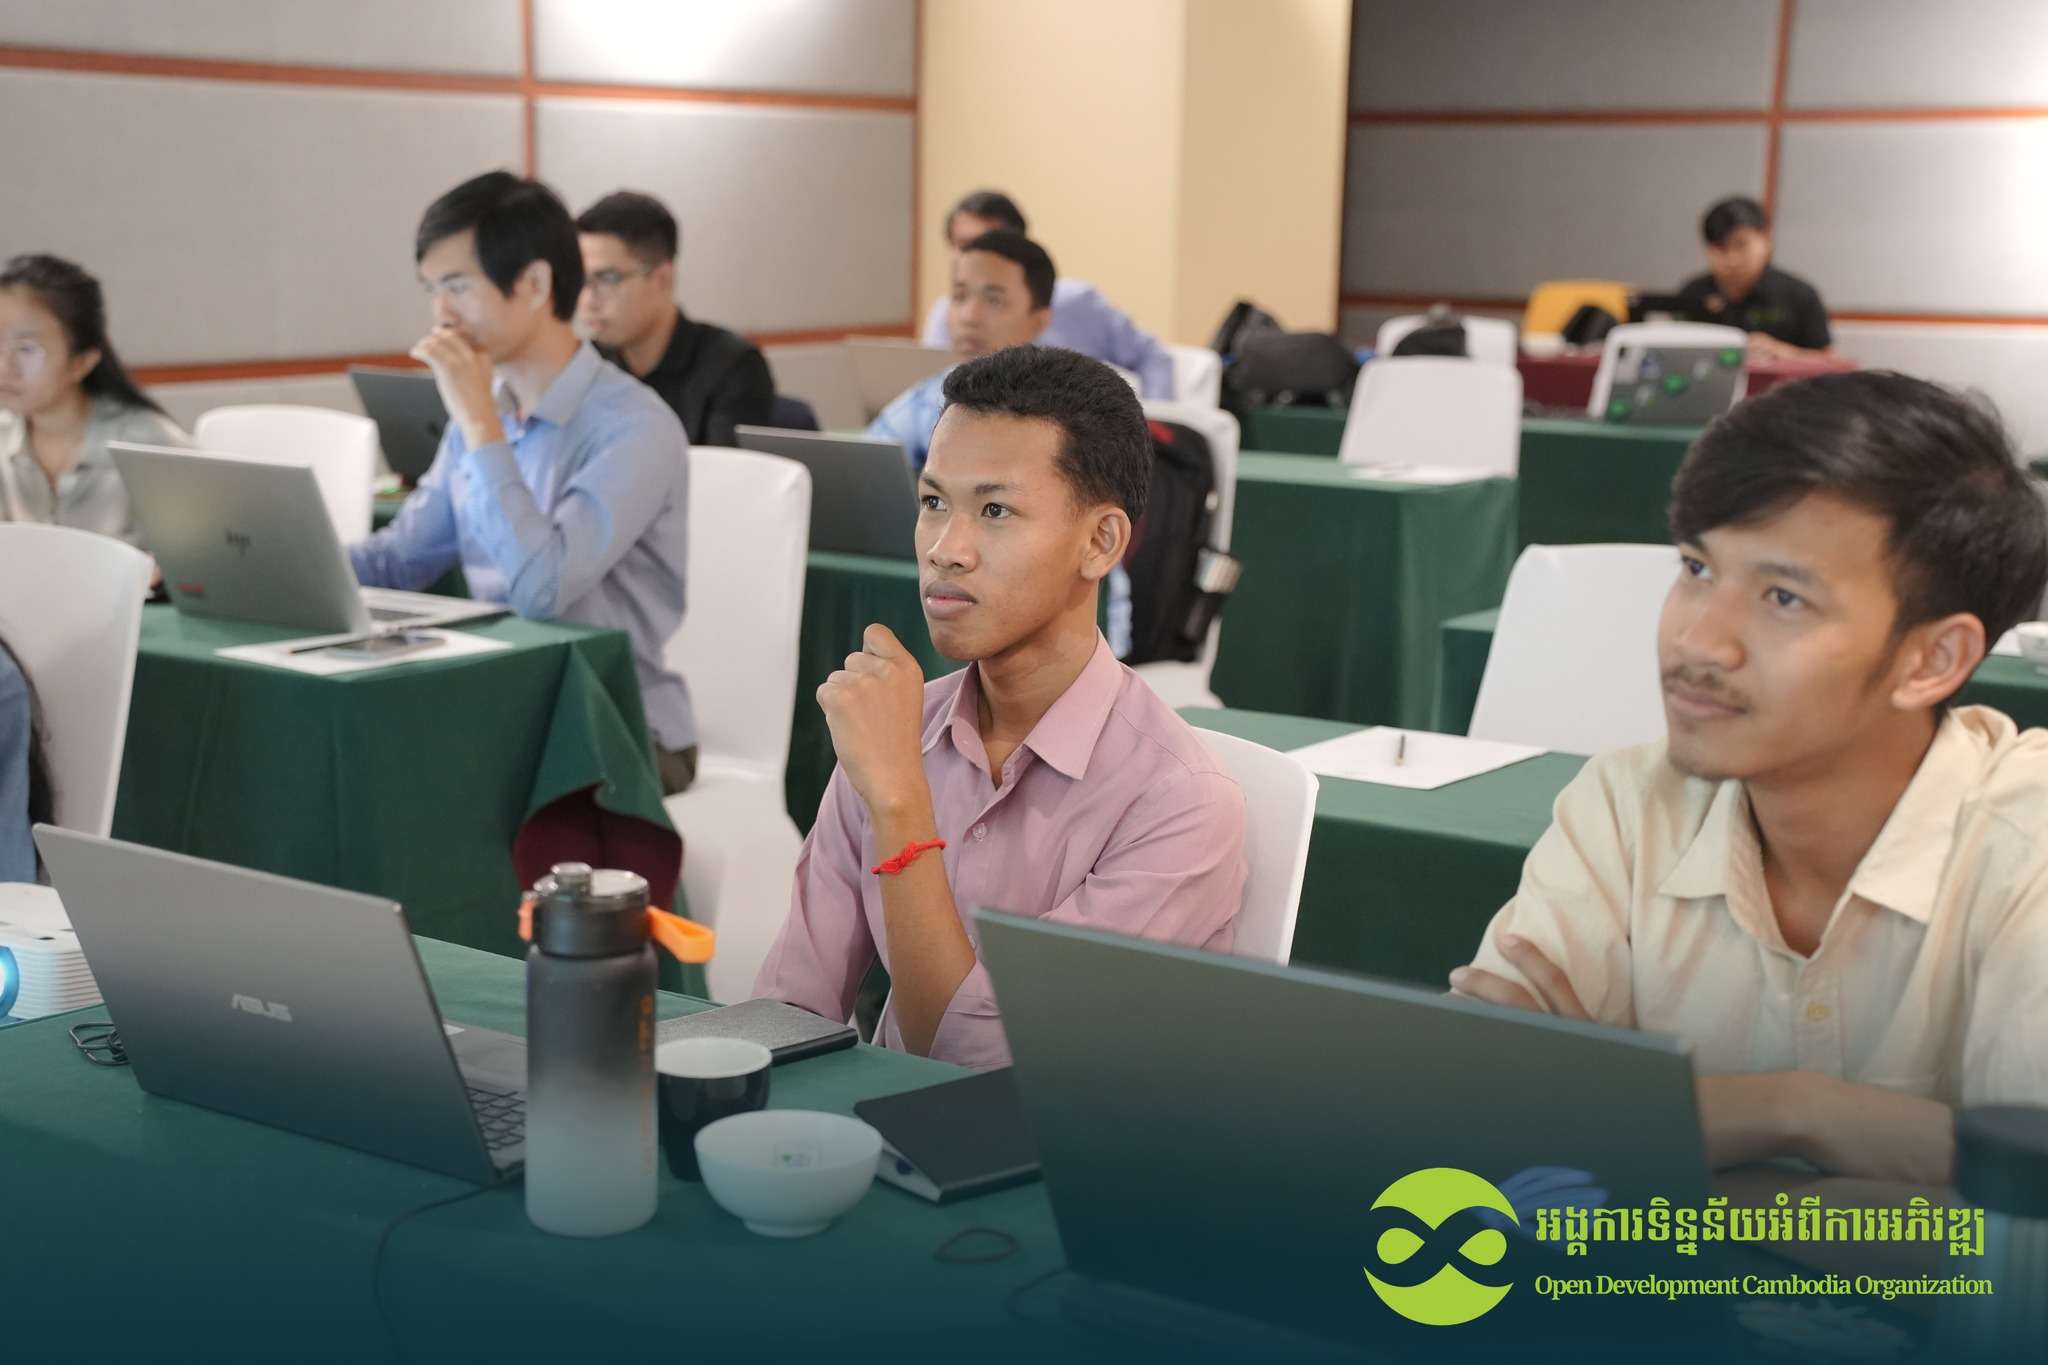

“The training is educational and relevant to practical situations for all individuals. Thank you!” a feedback from one of the trainees.

