វគ្គបណ្តុះបណ្តាលស្តីពី “ការធ្វើទស្សនីយកម្មទិន្នន័យសម្រាប់ការបង្ហាញសាច់រឿង”
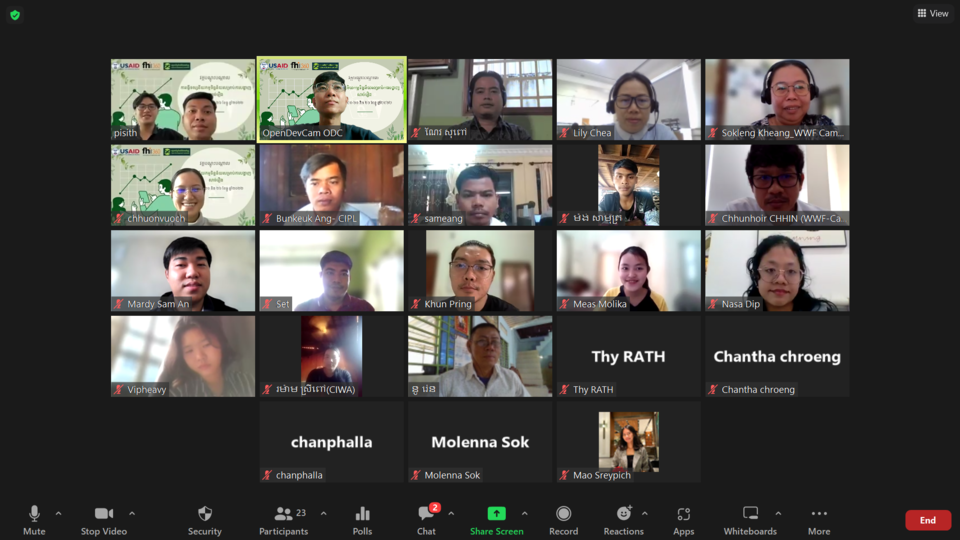
អង្គការទិន្នន័យអំពីការអភិវឌ្ឍ (អូឌីស៊ី) បានរៀបចំវគ្គបណ្តុះបណ្តាលមួយស្តីពី “ការធ្វើទស្សនីយកម្មទិន្នន័យសម្រាប់ការបង្ហាញសាច់រឿង” នៅថ្ងៃទី២០-២១ និង ២៦ ខែធ្នូ ឆ្នាំ២០២២ ដោយមានអ្នកចូលរួមសរុបចំនួន ២៤នាក់ រួមមានអ្នកសារព័ត៌មាន ពលរដ្ឋអ្នកសារព័ត៌មាន យុវជនជនជាតិដើមភាគតិចដែលធ្វើការលើសារព័ត៌មាន និស្សិតផ្នែកសារព័ត៌មាន និងអង្គការសង្គមស៊ីវិល។ ជនពិការ និងអ្នកស្រលាញ់ភេទដូចគ្នាត្រូវបានលើកទឹកចិត្តឱ្យចូលរួម។ វគ្គបណ្តុះបណ្តាលនេះចែកចេញជាពីរផ្នែក។ ដំណាក់កាលដំបូងគឺការបណ្តុះបណ្តាលតាមប្រព័ន្ធអ៊ីនធឺណិតរយៈពេលពីរថ្ងៃ ដែលរួមបញ្ចូលមេរៀន និងលំហាត់។ ដំណាក់កាលទីពីរគឺជាវគ្គបណ្តុះបណ្តាលដោយផ្ទាល់រយៈពេលមួយថ្ងៃ ដែលផ្តោតលើការរំលឹកមេរៀនឡើងវិញ និងលំហាត់បញ្ចប់វគ្គ។

វគ្គបណ្តុះបណ្តាលនេះត្រូវបានផ្តល់មូលនិធិដោយដោយទីភ្នាក់ងារសហរដ្ឋអាមេរិកសម្រាប់ការអភិវឌ្ឍអន្តរជាតិ (USAID) តាមរយៈអង្គការសុខភាពគ្រួសារអន្តរជាតិ (FHI 360) ក្រោមមូលនិធិសម្រាប់ចង្កោមអង្គការសង្គមស៊ីវិល ពីគម្រោងគាំទ្រអង្គការសង្គមស៊ីវិល (CSS)។
ថ្ងៃទី១៖ ការសិក្សាស្វែងយល់អំពីទិន្នន័យ
មុនចាប់ផ្តើមនៃវគ្គបណ្តុះបណ្តាល តំណាងអង្គការអូឌីស៊ីបានធ្វើសុន្ទរកថាស្វាគមន៍អំពីគម្រោង និងការណែនាំដើម្បីជួយអ្នកចូលរួមឱ្យស្គាល់គ្នាទៅវិញទៅមក។ បន្ទាប់ពីនោះ អ្នកចូលរួមបានធ្វើតេស្តមុនវគ្គបណ្តុះបណ្តាលដើម្បីវាយតម្លៃសមត្ថភាពរបស់ពួកគេ មុនពេលកម្មវិធីចាប់ផ្តើម។ លោក វង្ស ពិសិដ្ឋ ដែលជាគ្រូបង្គោលបានចាប់ផ្តើមមេរៀនស្តីពីការយល់ដឹងអំពីទិន្នន័យ ដើម្បីផ្តល់នូវការយល់ដឹងអំពីសារៈសំខាន់នៃទិន្នន័យ ប្រភេទផ្សេងគ្នានៃទិន្នន័យ និងព័ត៌មាន និងតម្លាភាពនៃទិន្នន័យបើកទូលាយ។ បន្ទាប់ពីអ្នកគ្រប់គ្នាយល់ច្បាស់អំពីទិន្នន័យ លោកក៏បានបង្ហាញពីរបៀបស្វែងរកទិន្នន័យដោយប្រើប្រាស់ឃ្លាំងទិន្នន័យ (Data Portal) និង Google advanced search។ បន្ទាប់មក អ្នកចូលរួមត្រូវធ្វើលំហាត់ដើម្បីស្វែងរកទិន្នន័យតាមតម្រូវការរបស់ពួកគេជាទម្រង់ PDF ក៏ដូចជាទិន្នន័យធនធានធម្មជាតិផ្សេងទៀតនៅលើឃ្លាំងទិន្នន័យរបស់អង្គការអូឌីស៊ី។

លោក បាន ច័ន្ទផល្លា ដែលលោកគ្រូបង្គោលម្នាក់ទៀត បានបង្ហាញនូវមេរៀនបន្ទាប់ស្តីពីស្តង់ដារទិន្នន័យ ដែលសង្កត់ធ្ងន់លើស្តង់ដារទិន្នន័យ និងរបៀបរៀបចំទិន្នន័យសម្រាប់ធ្វើទស្សនីយកម្មទិន្នន័យ។ លោកគ្រូបានណែនាំពីការបង្កើត spreadsheet ថ្មី ការបន្ថែមសន្លឹក ការបង្កើតច្បាប់ចម្លង ជួរឈរ និងជួរដេកថ្មី ការបញ្ចូលគំនូសតាង តម្រង់ និងការបង្កើតតារាង pivot នៅលើ Google Sheets ក៏ដូចជាការដាក់បញ្ជូលនូវឯកសារក្នុងទម្រង់ CSV ទៅក្នុង spreadsheet និង Microsoft Excel ។ គ្រូបណ្តុះបណ្តាលក៏បានបង្ហាញពីការសម្អាតទិន្នន័យដែលជាផ្នែកសំខាន់នៃការវិភាគទិន្នន័យ។ មេរៀននេះពន្យល់ពីមូលហេតុដែលយើងត្រូវការសម្អាតទិន្នន័យ ហើយណែនាំដល់សិក្ខាកាមក្នុងការប្រើវិធីសាស្ត្រសម្អាតទិន្នន័យ ដើម្បីធ្វើឱ្យវាអាចយល់បានដោយមានការណែនាំផ្នែកបច្ចេកទេសដូចជា កាត់ដកឃ្លា ដកស្ទួន ធ្វើទ្រង់ទ្រាយអត្ថបទ បំបែកជួរឈរ សុពលភាពទិន្នន័យ និងការស្វែងរក និងការជំនួស។
ថ្ងៃទី២៖ ការធ្វើទស្សនីយកម្មទិន្នន័យ
នៅថ្ងៃទីពីរនៃការបណ្តុះបណ្តាល លោកគ្រូបង្គោលបានចំណាយពេលពីរបីនាទីដើម្បីរំលឹកមេរៀនថ្ងៃមុន មុនពេលបន្តជាមួយនឹងរបៀបវារៈរបស់ លោក សំអាន ម៉ារឌី ស្តីពីគោលការណ៍នៃទស្សនីយកម្មទិន្នន័យ។ លោកនឹងណែនាំថាតើអ្វីដែលជំរុញយើងឱ្យបង្កើតទស្សនីយកម្ម អ្វីដែលជាទស្សនីយកម្ម របៀបបង្ហាញសាច់រឿងដោយប្រើប្រាស់ទិន្នន័យ របៀបជ្រើសរើសក្រាហ្វនិងប្រភេទគំរូសតាងឱ្យបានត្រឹមត្រូវ។ បន្ទាប់មក លោក វង្ស ពិសិដ្ឋ បានបង្ហាញនូវកម្មវិធី Flourish ដល់សិក្ខាកាមទាំងអស់។ បន្ទាប់ពីនោះ សិក្ខាកាមធ្វើការលើលំហាត់អនុវត្តជាក្រុម ដើម្បីបង្កើតតារាង និងក្រាហ្វដោយប្រើប្រាស់ Flourish ។ អ្នកគ្រប់គ្នាបានធ្វើតេស្តក្រោយវគ្គបណ្តុះបណ្តាលនៅថ្ងៃទីពីរ ហើយទន្ទឹងរង់ចាំវគ្គបណ្តុះបណ្តាលដោយផ្ទាល់នៅថ្ងៃទីបី។
ថ្ងៃទី៣៖ ការអនុវត្តដោយផ្ទាល់
របៀបវារៈសម្រាប់ថ្ងៃចុងក្រោយនៃការបណ្តុះបណ្តាល គ្របដណ្តប់លើការរំលឹកមេរៀន។ គ្រប់គ្នាបានចូលរួមវគ្គបណ្តុះបណ្តាលដោយផ្ទាល់ និងបន្តមេរៀនស្តីពីការធ្វើទស្សនីយកម្មទិន្នន័យដោយប្រើប្រាស់ Flourish ។ អ្នកចូលរួមបានចាប់ផ្តើមរៀនពីរបៀបបង្កើតគំនូសតាងផែនទីចេញពីទិន្នន័យភូមិសាស្ត្រ និងរបៀបបញ្ចូលទស្សនីយកម្មទិន្នន័យទាំងនោះទៅក្នុងសាច់រឿង។ បន្ទាប់មក អ្នកចូលរួមមានឱកាសក្នុងការអនុវត្តដោយផ្ទាល់ និងបំពេញលំហាត់ដោយបង្កើតការនិទានរឿងដោយប្រើប្រាស់ទស្សនីយកម្មទិន្នន័យ។ ជាចុងក្រោយ អ្នកចូលរួមទាំងអស់ធ្វើការវាយតម្លៃវគ្គបណ្តុះបណ្តាលមុននឹងសុន្ទរកថាបិទកម្មវិធី និងផ្តល់វិញ្ញាបនបត្របញ្ចប់វគ្គបណ្តុះបណ្តាល។


