N.B. After receiving feedback from Forestry Administration and other organizations, ODC has updated the data on this page and included forest cover 2014, adopting the methodology outlined in the notes that you can read here. Please contact us if you have any questions about these updates or the data shown here.
In 2006, Cambodia’s Department of Forestry Administration (FA) published a map showing Cambodia’s forest cover in 2002. Then in 2011, Forestry Administration, supported by the International Tropical Timber Organization and the Government of Denmark, published Cambodia Forest Cover 2010, which included maps of forest cover change between 2006-2010, and between 2002-20101.
As no official maps or analysis specific to Cambodia have been published since this date, ODC decided to create a set of updated forest cover maps.
This 2014 forest cover update reveals a continuing trend in forest cover loss—particularly dense forest—across Cambodia since 1973. For the first time in the 41-year period, the percentage of non-forest ground cover (48.4%) is larger than that of forest cover (47.7%).
The maps and animations on this page provide another tool to assess, and encourage research and discussion about, environmental change in Cambodia. They show a downward trend in forest cover across Cambodia from 1973 to 2014.
ODC first published this report in 2013 after six months of analysis by their qualified mapping team, and this update is part of their on-going analysis of new data, feedback and discussions with other experts and agencies. In response to technical analysis and feedback in 2013, these 2014 maps and analyses replace that 2013 publication. The Note section has more detail about the changes in this update.
Results
Summary
These maps reveal a trend of dense forest loss over the last 41 years in Cambodia, which supports the findings of other groups such as the University of Maryland (Hansen et al) and World Wide Fund for Nature (WWF). Maps based on the University of Maryland work are available at the Global Forest Watch website.
Regional animations
Cambodia

North

Virachey

East

West

Cardamon

South
Forest cover change trends
The bar graphs below depict Cambodia’s forest cover from 1973-2014, first as a percentage of total land area and second in total area (hectares). For detailed analysis of forest cover change and forest cover distribution on a national and provincial level click here.
Detail
Total forest cover in Cambodia has decreased from approximately 72% in 1973 to 48% in 2014, while dense forest has decreased from 42% to 16% over the same period. The level of mixed forest cover (inclusive of some plantations2) has stayed relatively stable over this period, being 30% in 1973 and 31% in 2014.
Categorizing mixed forest cover is complex, and may include various kinds of vegetation, crops and plantations. The Notes section has more detail of how ODC applied this classification.
The table below reveals the percentage of ground cover from various years for the five categories analyzed by ODC’s mapping team. See the Method and Technical Notes for discussions on how they arrived at these figures.
Table 1. Percentage of ground cover from analyzed satellite images of Cambodia
| Year | Forest cover | Dense forest | Mixed forest | Water | Non forest | Cloud |
|---|---|---|---|---|---|---|
| 1973 | 72.11 | 41.88 | 30.23 | 2.87 | 24.29 | 0.73 |
| 1989 | 67.92 | 38.99 | 28.92 | 2.64 | 29.35 | 0.10 |
| 2000 | 66.65 | 34.52 | 32.13 | 3.20 | 30.01 | 0.13 |
| 2004 | 63.05 | 30.66 | 32.39 | 2.51 | 33.95 | 0.49 |
| 2009 | 60.18 | 22.55 | 37.63 | 2.45 | 36.81 | 0.56 |
| 2014 | 47.68 | 16.45 | 31.23 | 3.67 | 48.41 | 0.24 |
The latest analysis of 2014 satellite imagery shows that, for the first time in these 40 years, the percentage of non-forest ground cover (48.41%) is larger than that of forest cover (47.68%).
These maps and animations were built from a series of satellite images from each year, selected for their clarity, lack of cloud cover and seasonality. See Method section for more detail.
Method
Overview
The forest cover map for each year was made from 16 to 19 satellite images, obtained from the United States Geological Survey (USGS). The images are free, publicly available and can be downloaded from the USGS website.
The earliest images available for Cambodia date from the early 1970s. ODC selected satellite images for analysis from 1973, 1989, 2000, 2004, 2009, and 2014 based on their quality, particularly the absence of cloud cover. Satellite images from 1989 on show an area of 30 meters by 30 meters for each pixel (30m resolution). The 1973 images had a 60m resolution.
The original satellite images contain multiple bands of color for a single image. Separating these colors allowed ODC to classify the type of ground cover shown as dense forest, mixed forest, non forest, water, or cloud (see the Definitions for more information on these classifications).
The samples below show different ground cover comparisons from Landsat 8 satellite images and Google Earth high-resolution images of the same area.
Dense forest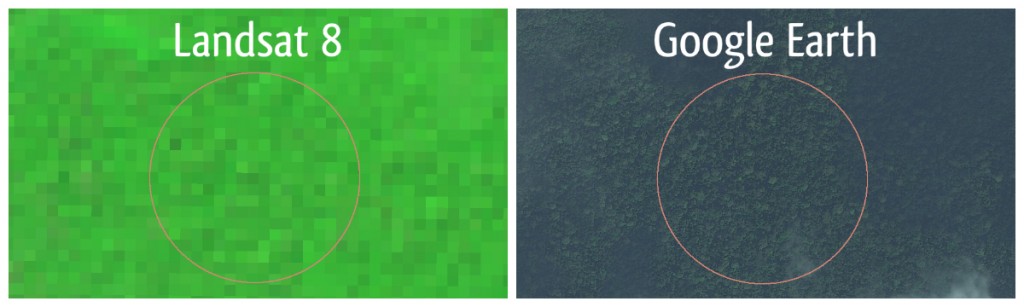
Mixed forest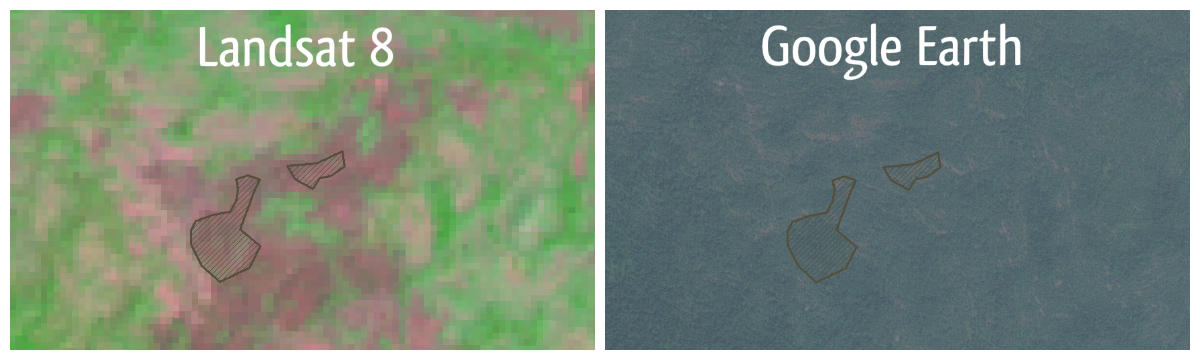
Agriculture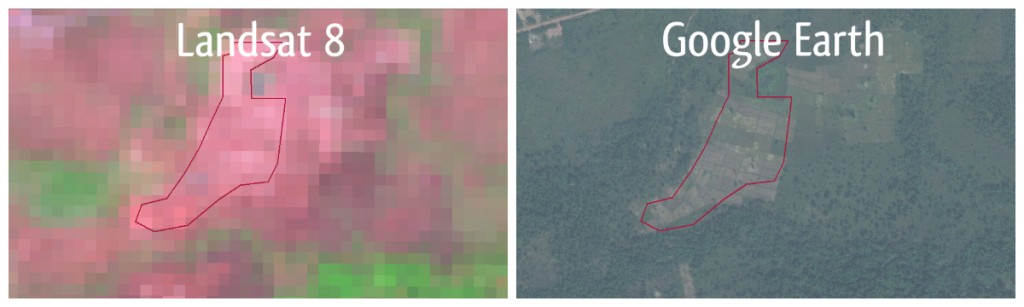
The animations were made to highlight areas of change in dense forest cover as a progression through those years. Dark green represents dense forest. Red on a map denotes areas of lost dense forest that were first detected on that year’s map. As the animation progresses to the next frame, red areas disappear to reveal the new status of the land as either mixed forest or non forest.
Mixed forest may fluctuate, sometimes increasing over the time series. This is because when dense forest is lost, it is often replaced by mixed forest. Mixed forest is sometimes difficult to distinguish from shrubland, hence its inclusion under the mixed forest classification. In the last map of the animation, red is used to show the total amount of dense forest lost between 1973 and 2014.
The maps prior to 2014 included plantations in the mixed or dense forest classifications, due to the difficulty in differentiating plantation crops from forest at the available image resolution. As part of their preparation for the 2014 analysis, mappers used high-resolution images to confirm the presence of the uniform stands of a crop or timber plantation. This was applied in areas more likely to contain plantations (such as those identified by the government as economic land concessions). This has resulted in a more accurate representation of dense forest for 2014.
Additional technical notes
- The available map resolutions required the use of image classification methodology, rather than other available methods to detect forest cover changes. This involved converting multiband raster images into a single composite band raster image. The composite band raster image allowed the mappers to identify five forest cover classifications to be mapped: dense forest, mixed forest, non forest, water and cloud. The band wavelengths used to classify the images are shown in Table 2, and are referenced from the United States Geological Survey website.
- Mappers used the Maximum Likelihood methodology to classify dense and mixed forest from image mosaics, applying image and band enhancement. No atmospheric correction was applied to satellite images prior to 2014. Based on technical advice gained following ODC’s 2013 forest cover maps, atmospheric correction was applied to the 2014 images. ODC decided to apply atmospheric correction to follow best practice in detecting ground cover change, however some studies conclude that when using a maximum likelihood classifier, this is not necessary.3
- Mappers built the 2014 forest cover map using satellite images from January and February 2014.
- Cloud shadow, hill shadow or water reflections appearing on a map presented classification challenges and verge areas can be subject to seasonal variances. Where these ambiguities were present on a map, the mappers analyzed later maps to mitigate the risk of incorrect classification.
- Prior to the 2014 analysis, ODC mappers were coached by external mapping experts in the use of methodologies using high resolution satellite images to verify the presence of plantations and crops on Landsat 8 satellite images. This allowed them to more accurately identify dense forest in their analysis by excluding some plantations.
- The 1973 forest cover map consists of 16 Landsat MSS images with 60 meter resolution. A mosaic was created from these images, to which color bands 3, 2 and 1 were applied to identify the Region of Interest. Landsat TM images were used at 30 meter resolution to create the 1989, 2000, 2004, and 2009 forest cover maps, with color bands 4, 3 and 2 applied. Landsat 8’s Operational Land Imager satellite images were used at 30 meter resolution to create the 2014 forest cover map. The map was analyzed by applying color bands 2 through 7 to identify the region of interest.
Table 2. Color wavelengths used to analyze satellite imagery
| Year | Satellite | Resolution | Color wavelengths applied |
| 1973 | Landsat MSS | 1 pixel = 60 x 60 meters | Band 1 (green) 0.5-0.6 Band 2 (red) 0.6-0.7 Band 3 (near infrared) 0.7-0.8 |
| 1989 2000 2004 2009 |
Landsat TM | 1 pixel = 30 x 30 meters | Band 2 (green) 0.52-0.60 Band 3 (red) 0.63-0.69 Band 4 (near infrared) 0.77-0.90 |
| 2014 | Landsat 8 | 1 pixel = 30 x 30 meters | Band 2 (blue) 0.45-0.51 Band 3 (green) 0.53-0.59 Band 4 (red) 0.64-0.67 Band 5 (near infrared) 0.85-0.88 Band 6 (short-wave infrared 1) 1.57-1.65 Band 7 (short-wave infrared 2) 2.11-2.29 |
Reference: The USGS website has details of how these color bands are used to identify different ground covers.
- A forest change detection model was used with the forest cover maps to depict the loss of forest from one map to the next, shown on five additional maps known as “forest cover change maps.”
- Each forest cover animation (national and regional) is composed of 12 static maps: the six forest cover maps and the six forest cover change maps.
- In differentiating dense forest, mixed forest and non forest classifications from the color bands, a maximum likelihood method was used in determining where plantations, crops, shrubland and other features not classified as dense forest would exist. For example, where economic land concessions had been identified in government publications. ODC was unable to apply more precise methods of classification, such as the decision tree methodology applied by Hansen et al4 in the University of Maryland study, due to the resources required for this methodology.
Who made these maps?
ODC’s team of qualified mappers began work on this project in February 2014. The team included Masters graduates from the Royal University of Agriculture’s natural resource management program, and the Remote Sensing and Geographic Information System program at the Asian Institute of Technology in Thailand. They are among the few Cambodians inside or outside of government to do this type of work.
They honed and developed their skills in satellite image analysis throughout the project, and have had ongoing training and support from external mapping experts, and are now skilled in this type of forest cover change analysis. ODC’s external consultants included a professor at Vietnam’s Can Tho University who completed his doctorate in the UK. He is a specialist in climate change modeling and reviewed the initial work performed by ODC’s mappers at each stage of the project, from image selection to image analysis and classification. From 2014, ODC’s advisors have included expert mappers from commercial and civil society organizations, as well as experts from Global Forest Watch.
The initial release of ODC’s forest cover maps in 2013 received feedback from several external organizations, including Cambodia’s Forestry Administration, that was used to improve the maps for 2014. One key point raised was the amount of cloud cover in the original 2013 images, hence ODC decided to replace the original maps made in 2013 with these from 2014. There were a number of other improvements made, which are highlighted below in our response to the Forestry Administration letter.
Scope
The ODC forest cover maps show trends in forest cover change, focusing on dense forest, from 1973 to 2014.
Classification of ground cover is limited to dense forest, mixed forest, non forest, water and cloud.
Limitations
While the forest cover change maps are a product of rigorous analysis and have been subject to review and improvement by a group of third party representatives from (among others) World Wide Fund for Nature (WWF) and Wildlife Conservation Society (WCS), there are some issues related to the nature of satellite ground mapping that present limitations.
- Trends, not confirmed percentages: The satellite imagery and methodology used provides enough data to indicate trends in forest cover change by showing where one classification has changed to another over time. While figures may differ from those of other similar studies where different methodologies or images were used, the trend in loss of dense forest cover is the same as that shown in several other studies, including World Wide Fund for Nature (2011 and 2013) and the University of Maryland (2013).
- Image resolution: Since the maps are based on satellite images with a resolution of either 60 meters or 30 meters, it was not possible to differentiate the specific tree species that comprise the forests. For this reason, and in line with Forestry Administration’s “Other Forest” classification5, the mixed forest classification also includes tree plantations. At this resolution it was not possible to identify small pockets of deforestation.
- Cloud cover: All of the satellite images used to produce the maps contained small amounts of cloud cover. In ODC’s forest cover maps, clouds are depicted as white areas. This presents a challenge for image classification, as information underneath clouds cannot be detected. To minimize the impact of this, ODC sought the clearest images with the least cloud cover. The 1973 image contained less than 1 percent cloud cover at 60 meter resolution. The 1989, 2000, 2004, 2009 and 2014 images also contained less than 1 percent cloud cover, but at 30 meter resolution. Where clouds were present on a map, the mappers classified the area as cloud cover.
- Season: Cambodia has two seasons: rainy and dry. The landscape of the country changes during each season. For example, vegetation is greener during the rainy season than during the dry season. There are also variations in the size of water-covered areas between the seasons. Since image classification involved combining multiple satellite images taken during different seasons, this may have led to slight variances in forest cover, mostly in verge areas where shrubland can be mistaken for mixed forest and vice versa at this resolution. Where these ambiguities were present on a map, the mappers analyzed later maps to mitigate the risk of incorrect classification.
- Marks and lines: There were instances of small lines appearing on maps – in 1989 over Western Cambodia, and two in 2009 over Mondulkiri. These lines resulted in negligible information gaps and have been removed in the latest 2014 maps. The presence of these data gaps in those two years does not detract from the overall forest cover trend revealed from 1973 to 2014.
- Ground truthing: Since these maps apply to the entire country, ground truthing was not feasible. Some industry ground truthing standards dictate a team of 2-4 people taking one day to analyze an area of 100 square meters6. The image classification method used to create these trend maps does not typically include ground truthing.
Definitions
Bands
Color bands are used to more accurately show ground features when performing classification of satellite images. The United States Geological Survey (USGS) website has more detail on the color bands used.
Composite band raster image
An image file where the separate bands of color have been converted to a composite showing red, green and blue light, or RGB.
Cloud
Cloud cover that was visible at the resolution of the satellite images used. There is more information on cloud cover in the Limitations section.
Dense forest
Areas classified as dense forest in these maps include “evergreen forest” and “semi-evergreen forest” as defined in the Forestry Administration’s Cambodia Forest Cover publication dated June 2010. Dense forest is mostly located at elevations higher than 500 meters, although Cambodia has also had large areas of lowland evergreen forests in the past. Dense forest may also be called old-growth forest. As part of their independent analysis of ODC’s 2014 data, Global Forest Watch approximated that the dense forest classification equated to tree canopy cover greater than 60 percent.
Evergreen forest
Forest comprised of trees that do not lose their leaves through seasonal abscission (dropping leaves in certain seasons annually).
Forest
As defined by the Food and Agriculture Organization of the United Nations (FAO 1998), forest is “Land with tree crown cover of more than 10 percent and area of more than 0.5 hectares. The trees should be able to reach a minimum height of 5 meters at maturity in situ.”
Forest cover
The area of land covered by tree canopy in an area classified as dense forest or mixed forest.
Ground truthing
Sending people with specialist equipment and measurement procedures on site to confirm data shown by satellite imagery. As this study considers the entire country of Cambodia, ground truthing was not feasible.
Mixed forest
Primarily regarded as dry mixed deciduous forest (deciduous trees drop and regrow their leaves seasonally.) Mixed forest may also include regrowth forest, stunted forest, mangroves, inundated or “flooded” forest, and bamboo, as well as forest plantations growing rubber, acacia, and eucalyptus or other tree crops. Areas classified as mixed forest in these maps include “deciduous forest” and “other forest” as defined in the Forestry Administration’s Cambodia Forest Cover 2010. It also includes “grass land” and “wood shrub land evergreen and wood shrub land dry” included in the “non forest” classification of the same publication. This is due to the limitation of color differentiation on the available satellite images.
Multiband raster image
An image file with more than one band of color recorded for each cell location. These bands correspond to a color segment on the electromagnetic spectrum.
Non forest
Non forest is not dense forest, mixed forest, water or cloud. Non forest includes urban areas, field crops, fallow or barren land, and other human-impacted areas. Areas classified as non forest in these maps align with “non forests” as defined in the Forestry Administration’s Cambodia Forest Cover 2010 publication dated October 20117, with the exception of “grass land” and “wood shrub land evergreen and wood shrub land dry”, which were included in mixed forest classification in this analysis.
Protected Areas
Areas of special value to Cambodia because of their resources, diversity or cultural heritage, and defined by the Protected Areas Royal Decree in 1993, and further detailed in the Protected Areas Law of 2008.
Raster image
A raster graphic or image is a bitmapped image, can be stored in a number of file formats, and is resolution dependent. For the purposes of mapping analysis, this means that they cannot be scaled beyond a certain resolution without loss of quality.
Satellite
An object placed in earth’s orbit that is able to photograph the planet’s surface at great distances. NASA’s Landsat satellites took the images used to generate the maps on this page.
Satellite image resolution
The scale of each pixel delivered in the satellite image file. For example, a resolution of 30 meters indicates that each pixel represents an area 30 meters times 30 meters.
Water
This represents all bodies of water that are visible at the resolution of each satellite image.
Response to Forestry Administration critiques
On 20 January 2014, the Cambodian Ministry of Agriculture, Forestry and Fisheries, Department of Forestry Administration (FA) responded to the original ODC Forest Cover Changes briefing of December 2013, with a critique published on their website (original Khmer document).
Their critique (original document in Khmer) raised a number of issues:
- Lack of a forest definition
- Minimum mapping unit not stated
- Cloud cover level unacceptable
- Seasonality of images
- Linking of borders in mosaic images
- No ground truthing or independent verification
ODC gave careful consideration to FA’s critique, along with feedback from other mappers, and used this to improve the 2014 maps. Below is a summary of ODC’s responses and the changes made.
Forest definition
The FA’s letter asked for ODC’s forest definition, however the maximum likelihood methodology used by ODC does not allow a percentage of minimum tree canopy cover to be applied. This can only be achieved through thorough ground truthing, or with the use of much higher resolution satellite imagery.
The dense forest definition used in this study is applied to a 30 x 30 meter area, based on the resolution of the imagery available. This maximum likelihood definition does not impact the trend of decreasing dense forest cover shown from 1973 until 2014. ODC looked for a definition for forest cover used by the Cambodian government, but were unable to find one. However, in their letter, FA stated that they had used 20% tree canopy cover in their latest report, so ODC will reference this definition in the future. ODC is not in a position to set a forest definition, and so applied a standard methodology to our analysis.
Minimum mapping Unit
As stated in the methodology and notes, the minimum mapping unit for 1973 was 60 x 60 meters, and for all other years was 30 x 30 meters, based on the satellite image resolution.
Cloud cover
As the FA letter correctly points out, the original 2013 maps ODC used for analysis had cloud cover greater than six percent, which led to difficulty in ground classification. The 2014 maps used as part of this latest analysis had just 0.24 percent cloud cover, returning them to an acceptable level. ODC decided to replace the 2013 maps with the new 2014 maps largely due to the issue of cloud cover.
Some provinces show an increase in dense or mixed forest in 2014, but this is due to areas of cloud cover that could not be classified in 2009, and are therefore now classified as either dense or mixed forest in 2014. The cloud cover in 2009 was still within an acceptable range, below 1 percent.
Seasonality
It is true that the same forest can appear larger or smaller in satellite imagery depending on the season. For ODC’s purposes, this may have led to variation in the area reported for mixed forest from year to year, depending on whether the images were sourced during Cambodia’s rainy or dry season. However, this difference would be minimal, and again, it would not affect the trend that is shown in the progressive loss of forest cover, and especially in dense forest cover. See the Limitations section for more discussion on this point.
Border linking
The FA letter mentions mistakes in combining or stitching together satellite images at their borders that duplicated or missed ground cover data. ODC mappers used standard industry practice and software to create geo-references on all images, meaning that those from different dates were not overlapped, and no data was missed. However, the mosaic for the 2014 maps contained no scan lines. The data for the 2014 maps have been reviewed by third-party organizations and closely match the findings of similar studies.
Ground truthing and independent verification
The Forest Administration asserted that two important requirements for forest cover reporting were omitted from ODC’s initial 2013 report: ground truthing and third-party (independent) assessment. While we agree that ground truthing is necessary to attain a complete, and verifiable forest cover result, there is a place for trend maps and studies, which can prompt further study and in-depth analysis. The resources required for ground truthing forests across Cambodia made this impractical for an organization the size of ODC.
Additionally, it is untrue to say that there has been no independent review. Following the publication of the original 2013 report, and throughout the analysis of the 2014 data, ODC has consulted expert individuals and organizations in the remote sensing and satellite imaging fields.
Other organizations, such as World Wide Fund for Nature (WWF) and Global Forest Watch (GFW) have compared the results and methodology with their own and offered advice on best practice.
ODC will continue to update these maps and notes on a regular basis, and will continue to consult with other organizations as part of this process, and to call for feedback and input from interested parties.
Links and resources
ODC encourages discussion and interaction on the findings of this project. These other organizations have conducted similar studies to assess Cambodia’s forest cover change using different methodologies.
World Wide Fund for Nature: Ecosystems in the Greater Mekong: Past trends, current status, possible futures (2013). http://cambodia.panda.org/news_cambodia/publications/?208456/Ecosystems-in-the-Greater-Mekong-past-trends-current-status-possible-futures
World Wide Fund for Nature: Living Forests Report (2011). http://wwf.panda.org/what_we_do/how_we_work/conservation/forests/publications/living_forests_report/
University of Maryland: Global Forest Change (2013). http://earthenginepartners.appspot.com/science-2013-global-forest.
Global Forest Watch: Cambodia. Cambodia. http://www.globalforestwatch.org/country/KHM
Food and Agricultural Organization of the United Nations: Information on forestry definitions and standards. http://www.fao.org/home/en/
Forestry Administration: Forest cover map (2002). http://www.forestry.gov.kh/AboutFA/ForestCoverMap.html
Forestry Administration: Letter to the Minister of Agriculture, Forestry, and Fisheries to critique ODC Forest Cover Report, 2013 (Original letter in Khmer).
http://www.opendevelopmentcambodia.net/pdf-viewer/?pdf=download/ministry-report.pdf
Forestry Administration: Laws, Decrees, Sub Decrees and Regulations Concerning Forestry. http://fa.maff.gov.kh/documents/yfyfMXOBSi?lang=kh
Council for the Development of Cambodia: Paper prepared by the TWG Forestry & Environment for the Cambodia Development Cooperation Forum, 19-20 June 2007.
Forest cover changes in Cambodia 2002-2006. http://www.cdc-crdb.gov.kh/cdc/first_cdcf/session1/forest_cover_eng.htm
United States Geological Survey: Earth Explorer Satellite Imagery. http://earthexplorer.usgs.gov/
References
- 1. Forestry Administration, Ministry of Agriculture, Forestry and Fisheries. (2011). Cambodia Forest Cover 2010. http://www.twgfr.org/itto/wp-content/uploads/2012/06/Cambodia-Forest-Cover-2010_KH.pdf. Accessed 31 March 2015.
- 2. Including tree plantations in mixed forest figures is consistent with the Cambodian government’s approach to assessing forest cover, as shown in the Forestry Administration’s Cambodia Forest Cover publication dated October 2010.
- 3. Song, Conghe, Curtis E. Woodcock, Karen C. Seto, Mary Pax Lenney, and Scott A. Macomber. “Classification and Change Detection Using Landsat TM Data: When and How to Correct Atmospheric Effects?”, Remote Sensing of Environment 75 (2001): :230-244.
- 4. Hansen, M.C., P.V. Potapov, R. Moore, M. Hancher, S.A. Turubanova, A. Tyukavina, D. Thau, S.V. Stehman, S.J. Goetz, T.R. Loveland, A. Kommareddy, A. Egorov, L. Chini, C.O. Justice, and J.R.G. Townshend. “High-Resolution Global Maps of 21st-Century Forest Cover Change”, Science 342 (15 November 2013): 850-853. [DOI:10.1126/science.1244693].
- 5. Forestry Administration, Ministry of Agriculture, Forestry and Fisheries. (2011). Cambodia Forest Cover 2010. http://www.twgfr.org/itto/wp-content/uploads/2012/06/Cambodia-Forest-Cover-2010_KH.pdf. Accessed 31 March 2015.
- 6. International Tropical Timber Organization. Field Manual on Ground Truthing and Tree Inventory (2007).http://www.itto.int/files/user/pdf/publications/PD%20239%2003/pd239-03-3%20rev1%28F%29%20e.pdf. Accessed February 19, 2015.
- 7. Forestry Administration, Ministry of Agriculture, Forestry and Fisheries. (2011). Cambodia Forest Cover 2010. http://www.twgfr.org/itto/wp-content/uploads/2012/06/Cambodia-Forest-Cover-2010_KH.pdf. Accessed 31 March 2015.

