FFI Data Literacy Training was a success

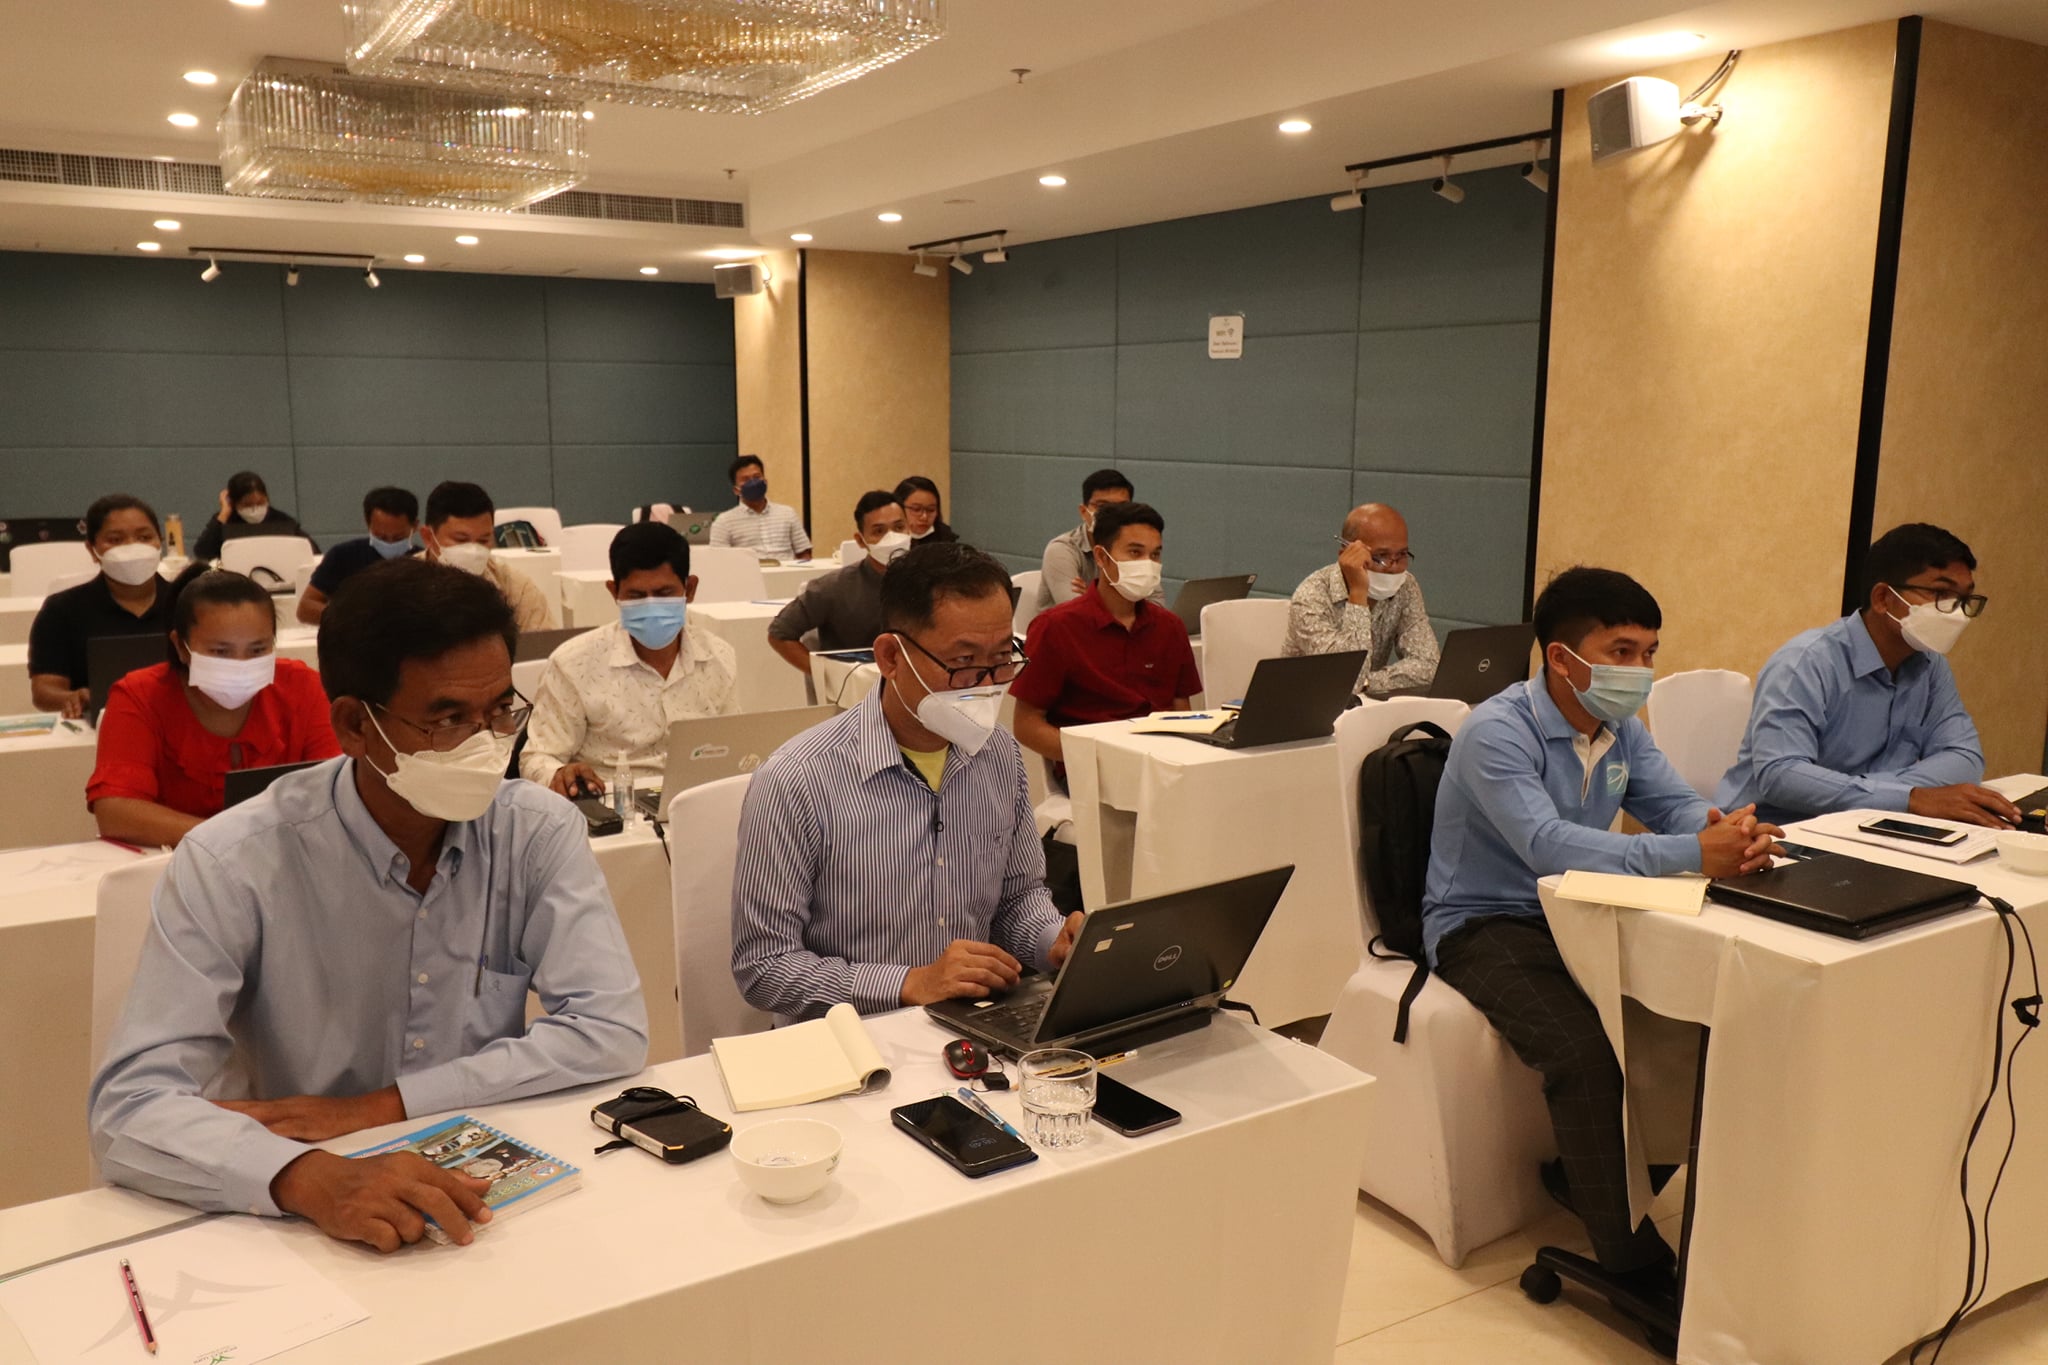
On 06th-08th April 2022, in collaboration with Fauna & Flora International (FFI), Open Development Cambodia (ODC) successfully conducted basic Data Literacy Training at Poulo wai Hotel with the financial support of the Blue Action Fund under the project “Strengthening Marine Protected Areas (MPAs), fisheries governance and coastal community livelihoods in Cambodia.” After finishing the capacity need assessment among the project partners including (FFI, FCEE, FACT, SSF, CWDCC), 16 participants (3 females) involved in the MPAs project in the target areas, were invited for the training. The government officials from the Ministry of Environment and Preah Sihanouk provincial fisheries administration have also participated. The three-day event equipped trainees with useful and necessary data skills, including data cleaning, analysis, and data storytelling. Marine protected area-related themes are used to give ground to familiarity, allowing them to deeply understand data, deploy concrete examples, and see the immediate impact of data visualization in their day-to-day lives.
ODC has actively provided basic Data Literacy Training (DLT) for different stakeholders such as government officials, NGO officers, journalists, and students. The training ensures that trainees are well equipped with fundamental literacy and data analysis, data visualization and data storytelling skills. Trainees will be able to utilize the existing data, read and generate information from data, and ultimately allow them to produce data storytelling and visualization to describe, deliver the message, and raise awareness over specific issues. The training curriculum will also touch upon the use of data-related tools such as Flourish and Turbula.
The three-day training program covers four essential modules. Module1: Understanding data, Module2: Basic data cleaning, Module3: Basic Data analysis, and Module4: Basic storytelling. These modules are designed and led by Mr. Vong Pisith (ODC Senior Data Research and GIS Officer), Mr. Loch Kalyan (ODC Data Research and GIS Specialist) and Mr. Sam An Mardy (ODC IT and website manager).
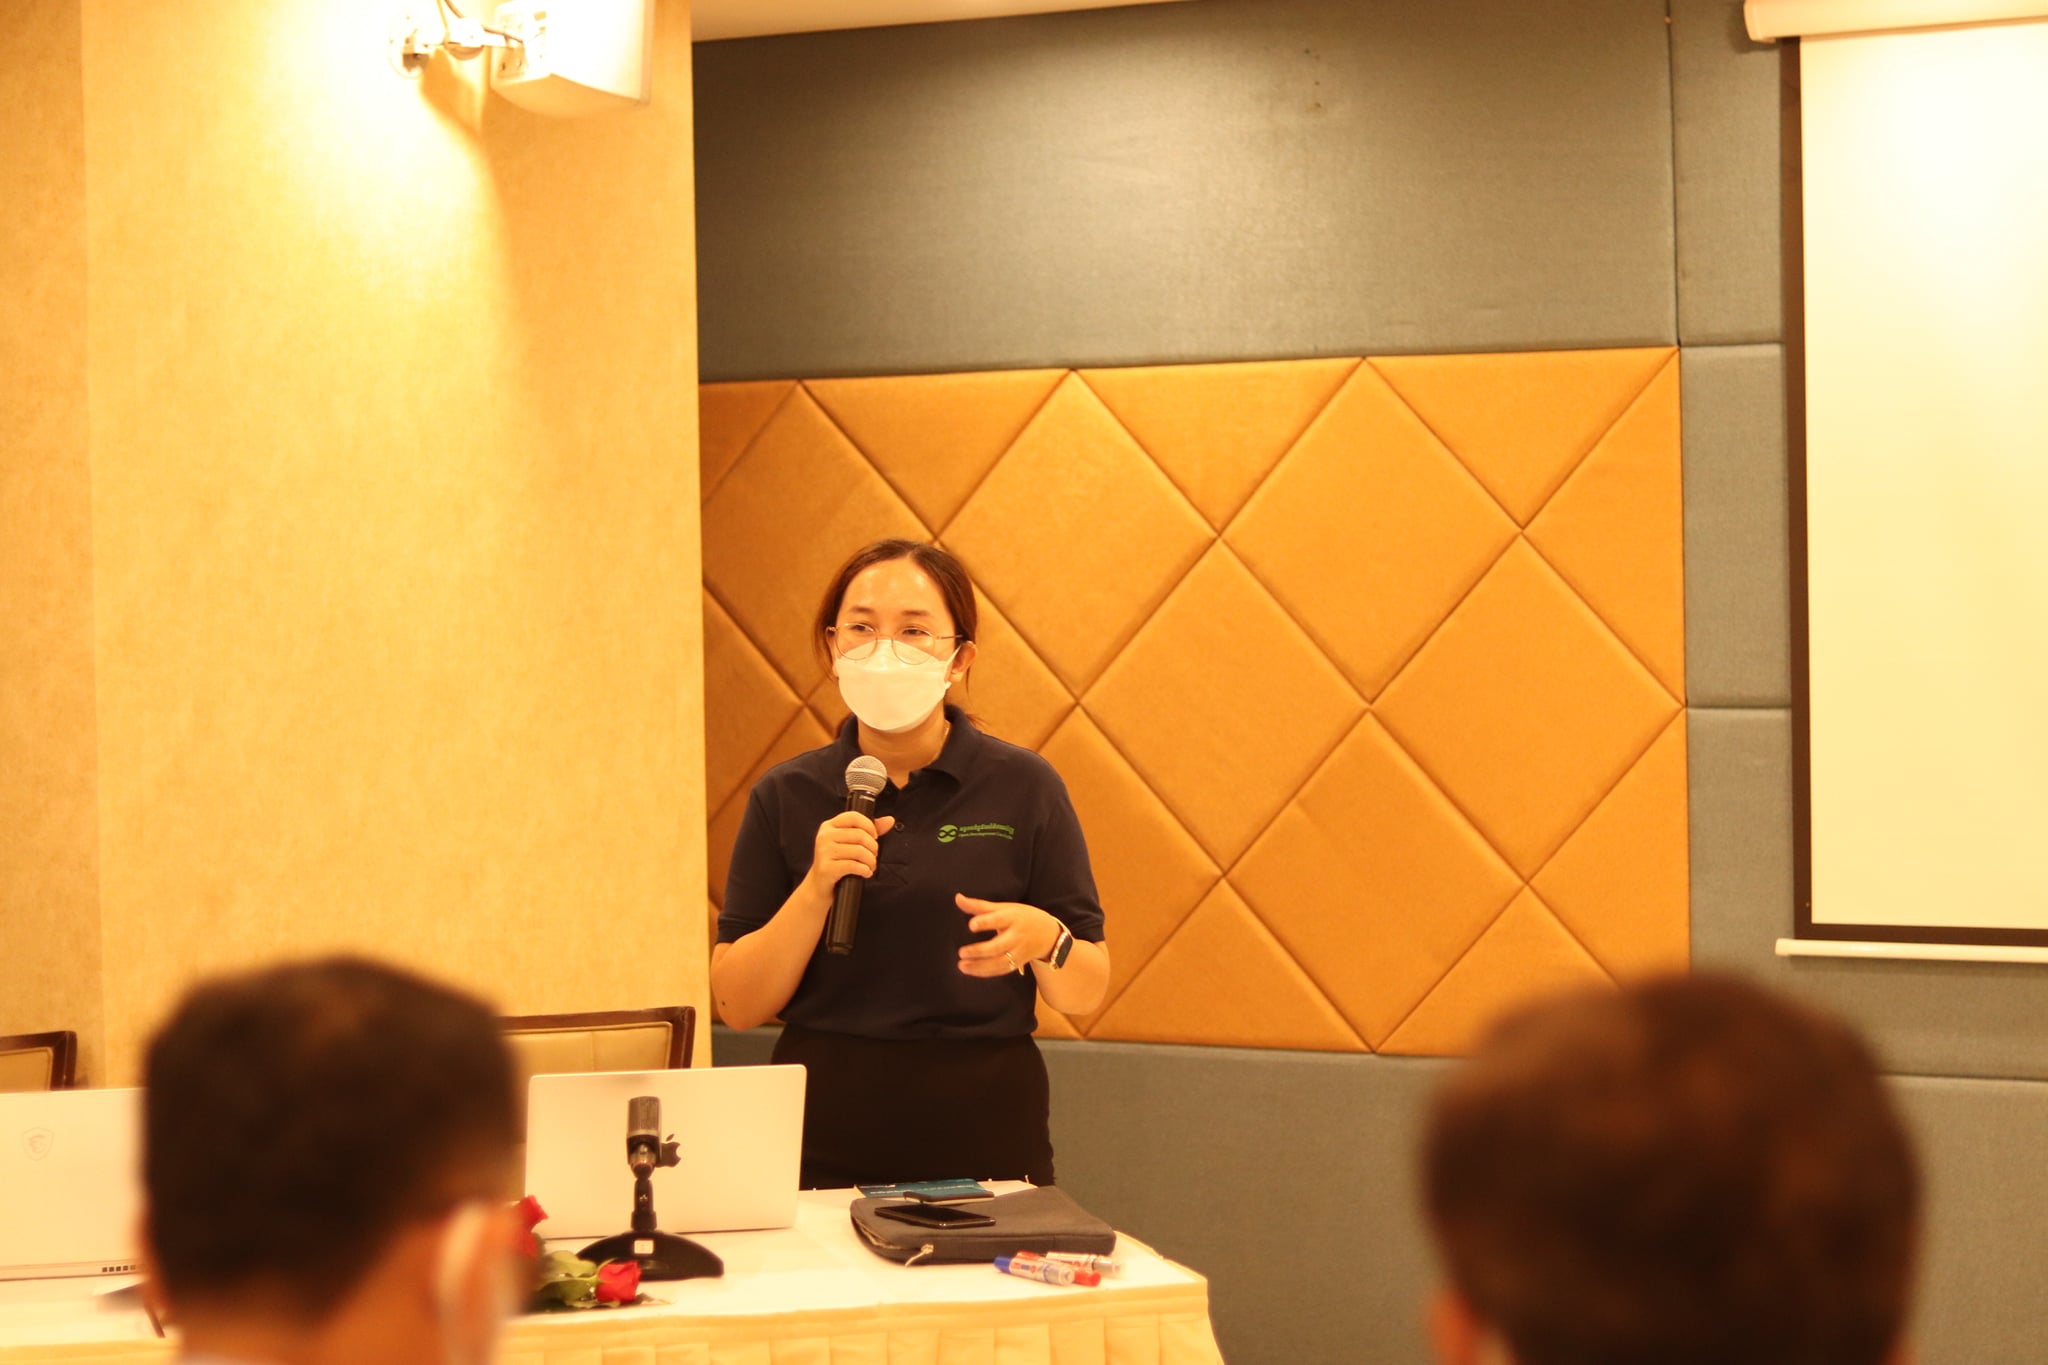
Mrs. Siv Vatana, ODC’s Research and Web Content Manager, gave a welcoming remark to kick start the Data Literacy Training. She expressed her gratitude to the donors who allowed this training program to happen. She hoped all of the participants advanced skills related to data and hoped that everyone would fully utilize what they have learned from the event. After a quick introductory session between trainers, facilitators, and participants, everyone seemed to be energetic to learn.
On the first day, the participants studied Modules 1 and 2. As the name of the modules suggested, participants are exposed to the fundamental concept of data, its definitions, the relation between data and story, different types and characteristics of data and how data can be used to analyze and generate storytelling. Moreover, Mr. Loch Kalyan and Mr. Sam An Mardy have instructed the participants on data cleaning by using Google Spreadsheet. The cleaning aims to ensure that data are at the proper standard before analyzing and to resolve problems within the data such, as incompleted fields, different formats, duplicate entries, and misspellings. At the end of the session, trainees can practice and apply what they have learned on their hands. The first day was concluded with ease.

The second day started with some revision questions by Mr. Vong Pisith. He asked the participants what they had learned from day one. Then, he began to lecture lessons based on Module 3. The sole purpose of this module is to enrich participants with basic data analysis. The lesson covered on day two is the hypothesis, forming questions for data analysis, data visualization and the demonstration of Flourish (data visualization tools). The participants were required to formulate a hypothesis that served as key criteria for data analysis. Participants also get to experiment with different types of charts that represent and serve different purposes and types of data. Module 3 contains more hands-on practices as participants learn to analyze data using Google Spreadsheet and generate data visualization using Flourish. Day two was more interactive compared to the previous day. Participants got to work in a group and exchanged their interests and ideas.
Then, Module 4, which focuses on data storytelling, is on the agenda for the last day of the training program. Day three compiled all the necessary knowledge and skills that participants had learned on day one and day two to create a story about data. Mr. Sam An Mardy gave a lecture on simplifying data findings. This session applies critical thinking skills that require participants to convert data into a simple term that readers can relate to. Some ways of simplifying data include:
- converting from a percentage into a fraction,
- converting statistical data into a concept that is easy to tell,
- rounding the decimal and fraction and data comparison.
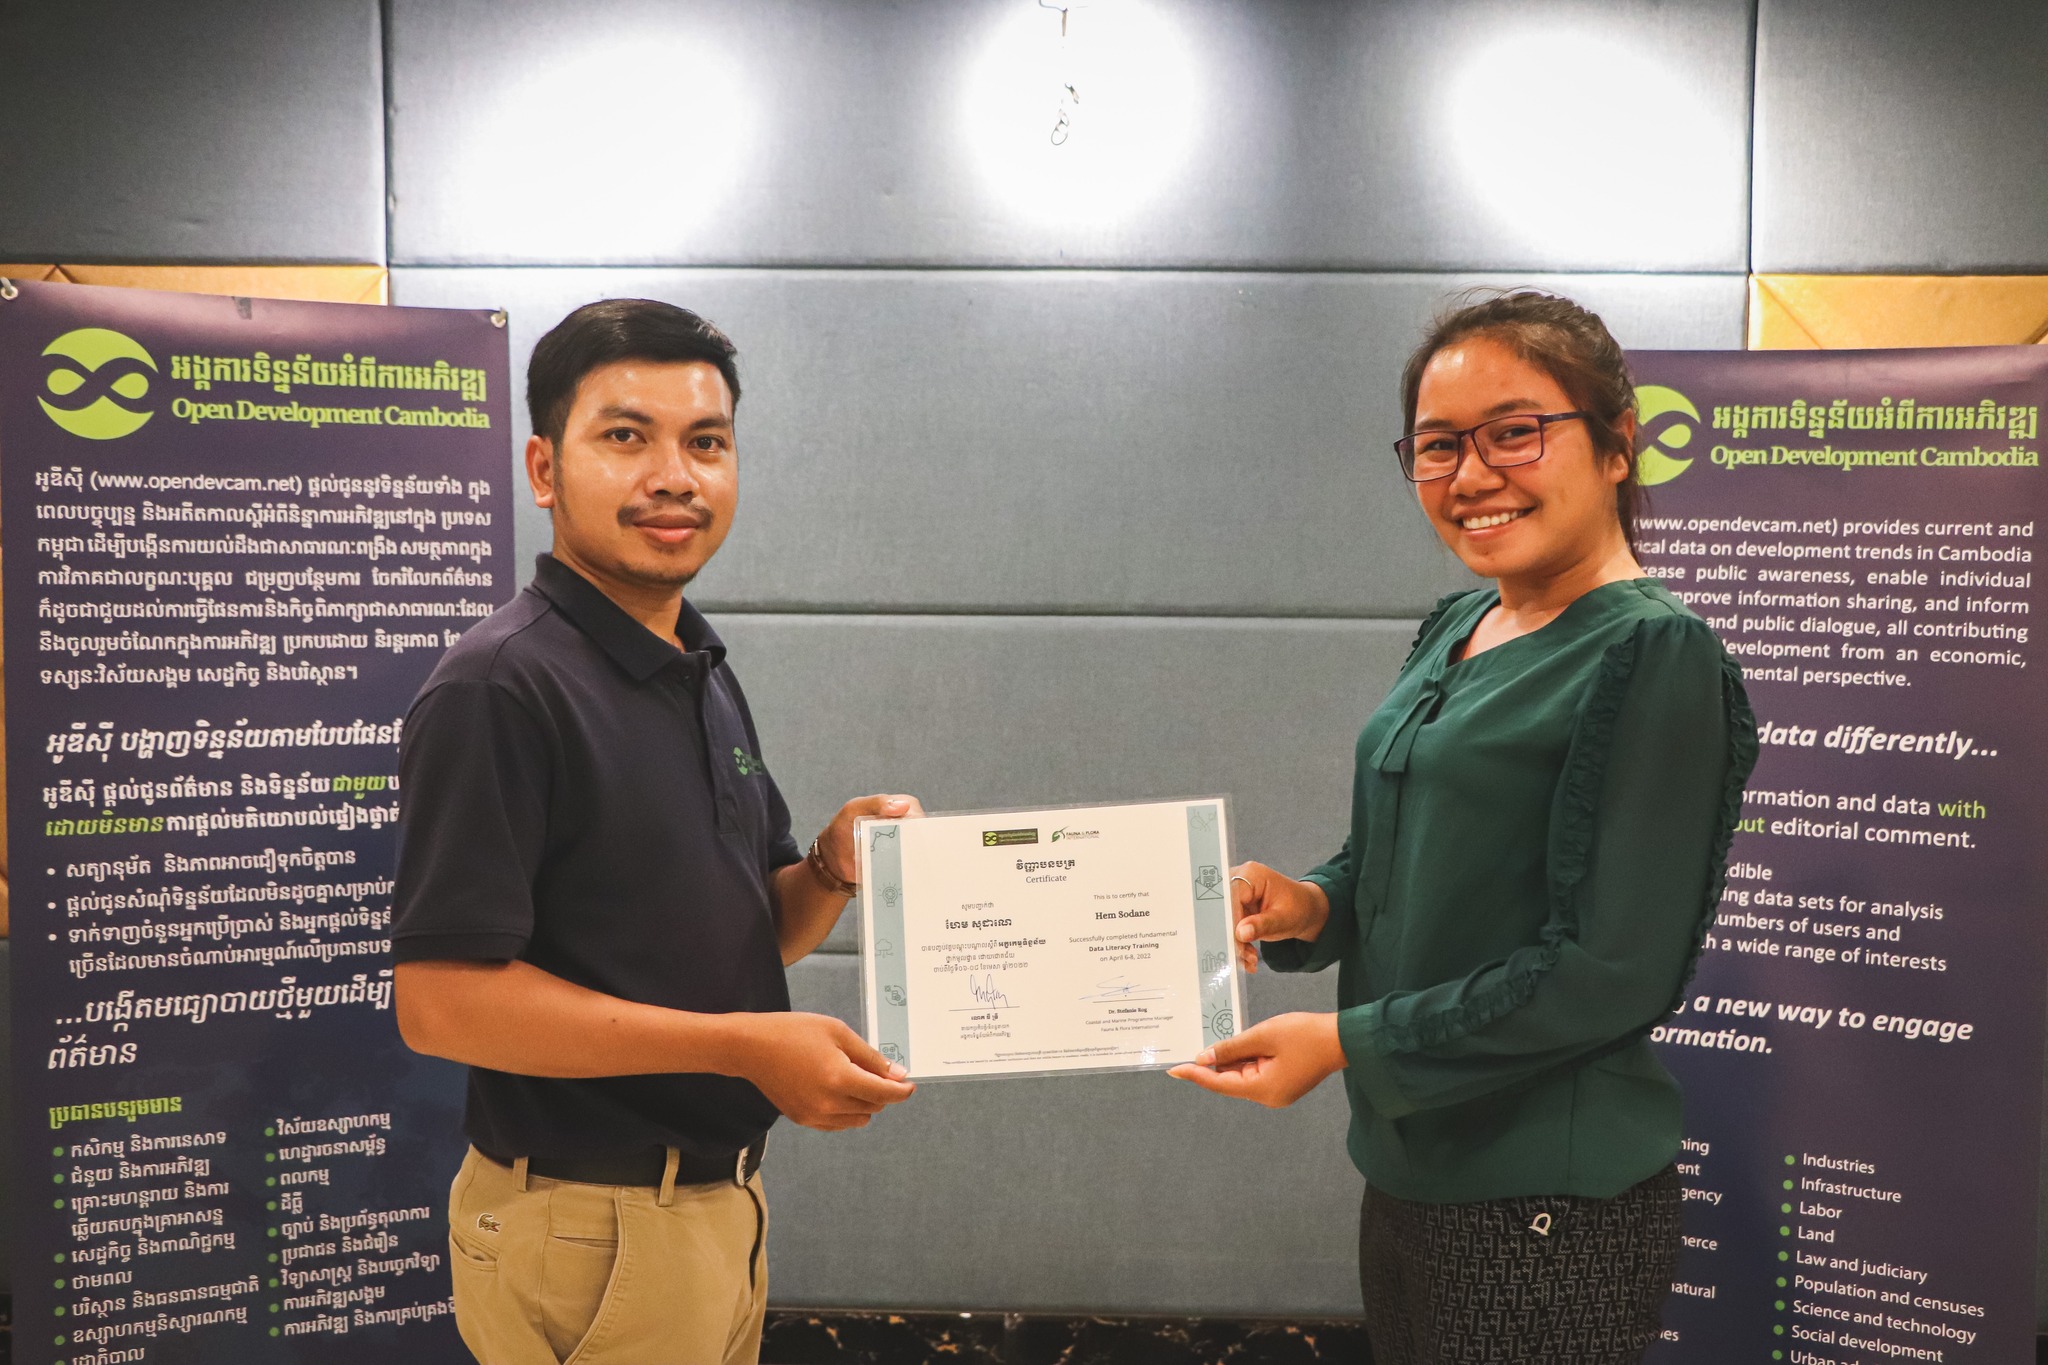
Another important session was the principle of chart design. Mr. Vong Pisith instructed the class on designing charts to fit with different types of data and enrich the value of data to the readers. The last session of the day was a practice session. Participants explore Flourish and attempt to create their own data story in the form of an interactive chart. A Certificate ceremony concluded the Data Literacy Training. Each participant is certified that they have completed Data Literacy Training.
Some participants have expressed their views and interests over the three days event. One participant from Sihanouk ville Fisheries Administration of the Department of Agricultural, Forestry and Fisheries has stated that the training is vital for fisheries administration to protect and analyze existing fisheries data and allow him to interpret statistical data into reports. Another Participant from FFI has urged other relevant stakeholders who have not joined the training to join as it provided useful skills in data preparation, management and visualization. He added that the training also introduced him to new technology that functioned to visualize data.

